Use Excel to automate financial statement analysis
Q. I often perform horizontal, vertical, and trend analysis for clients. Each time revised financial statements arrive, I find myself recreating formulas, rechecking ranges, and confirming that calculations are copied correctly. This process takes forever, and I worry about missed updates, inconsistent calculations, and hidden spreadsheet errors. Is there a way to build a standardized Excel workbook that performs financial statement analysis automatically and updates when new data is received?
A. Yes, you can design a reusable analysis workbook that automates horizontal, vertical, and trend analysis. By organizing source data into Excel tables and using structured formulas, you can refresh the analysis simply by pasting new statements into the model, without rewriting formulas or rebuilding schedules.
I used Microsoft Excel 365 for PCs to create this example. Other Excel versions may work differently. You can download the Excel file used for this example and view a video demonstration at the end of this item.
The example starting in the next paragraph produces a multiyear financial statement analysis workbook that performs horizontal, vertical, and trend analyses automatically. The workbook is structured so that all calculations update automatically when new data is entered.
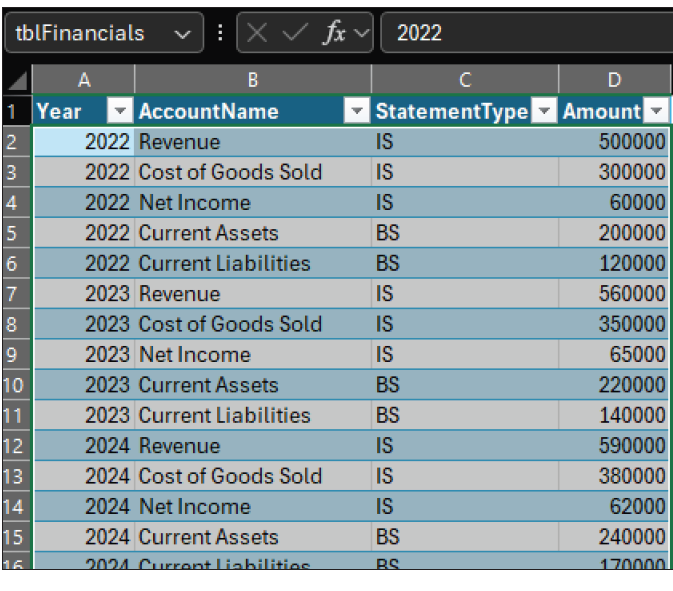
First, paste the company’s income statement and balance sheet data into a clean worksheet and name it Financial_Data. Include the following columns: Year, AccountName, StatementType, and Amount. For consistency, use standardized account names across all periods.
Click any cell inside the dataset. From the Ribbon, select Insert, then Table, and confirm that My table has headers is checked. Click OK. While the table is still selected, go to Table Design within Table Tools, then click Table Name and rename the table to tblFinancials.
It is important to use a table in Excel because it automatically expands as you add or remove rows. This feature ensures your formulas always reference the complete dataset, even when you add new, or remove older, periods. Additionally, tables enhance readability and minimize the risk of broken references. Refer to the screenshot at the top of the next page for the financial data organized as tblFinancials.
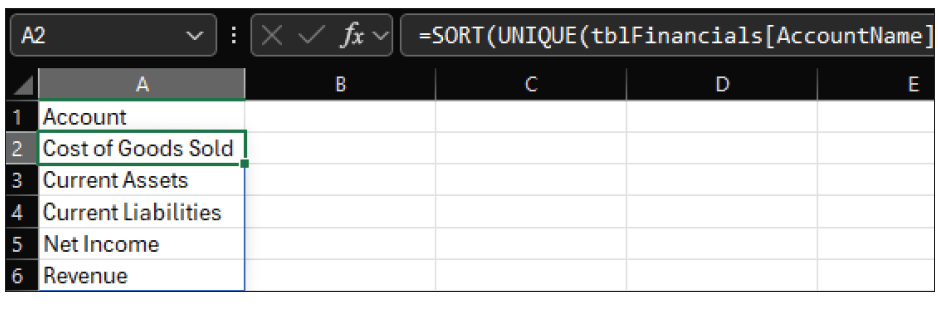
Insert a new worksheet and name it Analysis. In cell A1, type Account. In cell A2, enter the formula =SORT(UNIQUE(tblFinancials[AccountName])). This formula produces a distinct, alphabetical list of all accounts present in the dataset. If new accounts appear in later years, they will be added automatically. This prevents omissions that commonly occur when manually maintaining account lists. See the following screenshot for the generated account list.
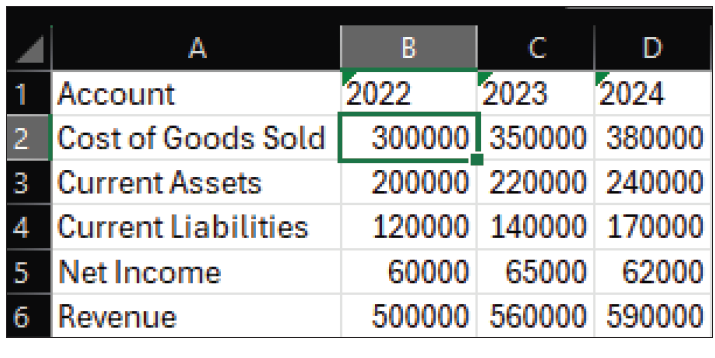
Create columns for each year across row 1 of the Analysis sheet. In cell B1, enter the first year, and continue across the row for each reporting period. In cell B2, enter the following formula: =SUMIFS(tblFinancials[Amount], tblFinancials[AccountName], $A2, tblFinancials[Year], B$1). Copy this formula across and down. This retrieves the appropriate account balances for each year and ensures consistency across periods. See the following screenshot for populated financial data.
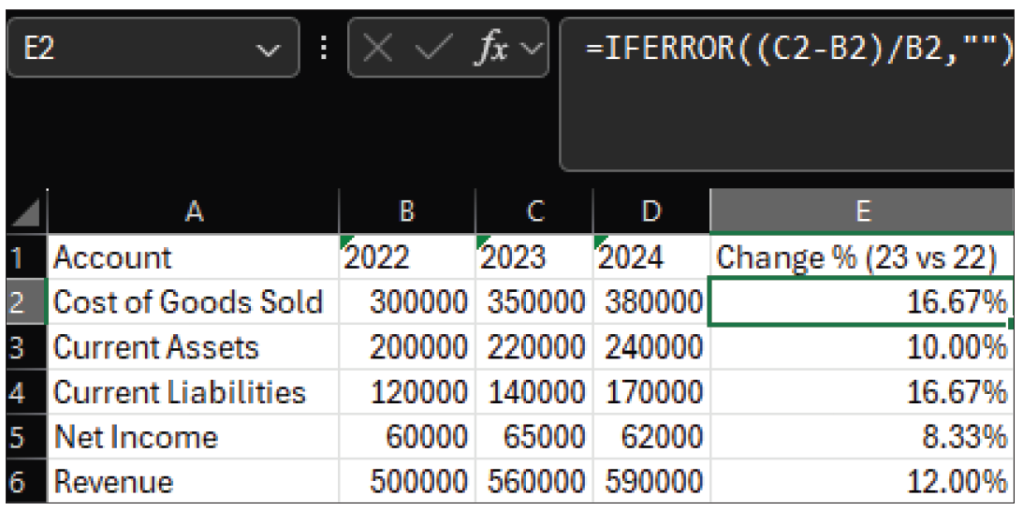
Horizontal analysis emphasizes year-over-year changes that may warrant further investigation. To calculate horizontal analysis, insert a column labeled Change % (23 vs 22) in cell E1. In cell E2, enter =(C2-B2)/B2. Format the result as a percentage, formatted to two decimal places, and copy the formula down. If prior-year balances are zero, add IFERROR to avoid division warnings: =IFERROR((C2-B2)/B2,””). Refer to the following screenshot for the results of the horizontal analysis.
Repeat the preceding steps to compare 2024 to 2023 percentage changes; copy and paste or drag the second-cell formula into the new column’s second cell.
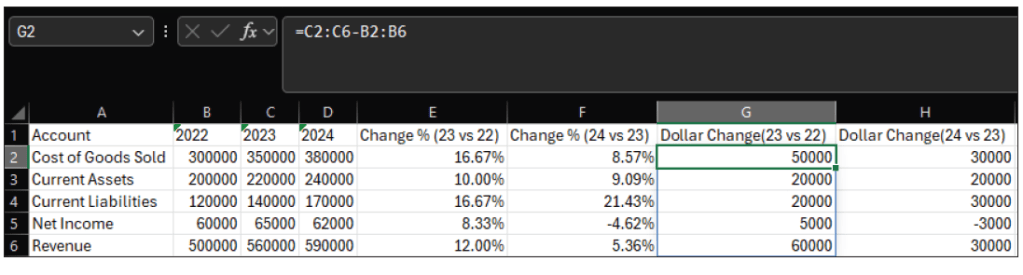
Percentage changes are useful for identifying relative growth or decline, but practitioners often need to see the absolute dollar impact of year-over-year changes. This is part of horizontal analysis. A small percentage change in a large account balance can represent a material shift in overall financial position, while a large percentage change in a small account may be less significant. Including dollar changes alongside percentage changes provides important context for professional judgment.
To calculate dollar changes, insert a new column in the Analysis worksheet and label it Dollar Change(23 vs 22). Position this column next to the Change % column. In the first calculation cell, enter the following formula: =(C2:C6-B2:B6). Complete the same steps to compare 2024 to 2023; copy and paste or drag the second-cell formula into the new column’s second cell. See the following screenshot for the complete horizontal analysis.
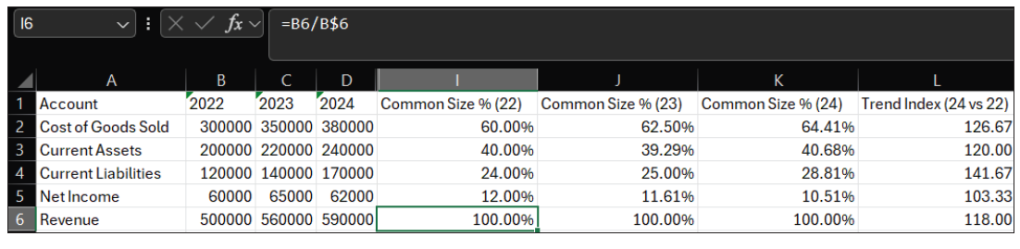
For vertical analysis, insert columns labeled Common Size % (22), (23), (24). Assuming revenue appears in row 6, enter =B6/B$6 for the Common Size percents for 2022 in cell I6. Copy the formula up or down and format it as a percentage. Do the same for the columns representing 2023 and 2024. This expresses each account as a proportion of total revenue, allowing comparisons across companies and time periods. See the following screenshot for vertical analysis.
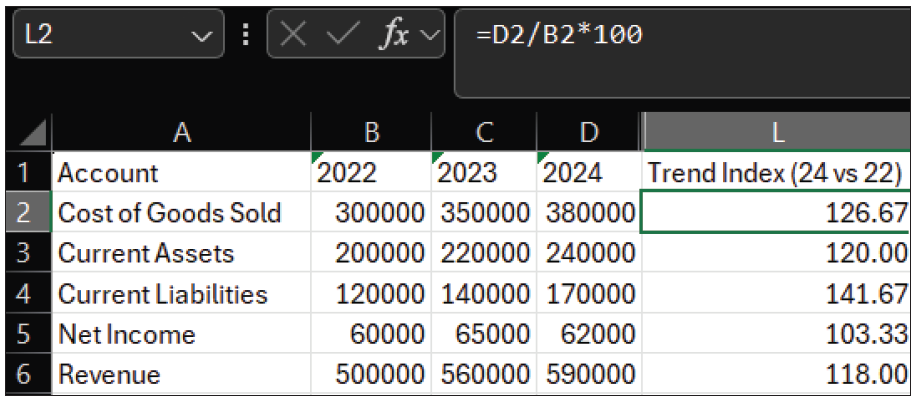
Trend analysis is particularly useful for identifying structural changes in business performance. To implement trend analysis, select a base year for comparison, typically the earliest year in the dataset. Insert a column labeled Trend Index (24 vs 22) in cell L1. In cell L2, enter =D2/$B2*100. Copy the formula down. Format to two decimal places, if you like. Values above 100 indicate growth relative to the base year, while values below 100 indicate contraction. See the following screenshot for trend indexes.
You could certainly expand this financial analysis further. By investing time in building an automated financial statement analysis workbook, you can improve accuracy, efficiency, and consistency.
About the author
Kelly L. Williams, CPA, Ph.D., MBA, is an associate professor of accounting at the Jones College of Business at Middle Tennessee State University.
Submit a question
Do you have technology questions for this column? Or, after reading an answer, do you have a better solution? Send them to jofatech@aicpa.org.


