- column
- TECHNOLOGY Q&A
Doing accounts receivable aging reports in Excel
Related
Differentiating agentic and generative AI — and more with a Tech Q&A author
How AI is transforming the audit — and what it means for CPAs
Promises of ‘fast and easy’ threaten SOC credibility
TOPICS
Q. I manually maintain an accounts receivable aging report at our office because we use a simple cash-based accounting system that doesn’t offer such reporting. Is there a way to make this more automated?
A. Accounts receivable (AR) aging analysis is a critical tool for businesses to monitor outstanding customer invoices and manage cash flow effectively. By categorizing invoices based on their due dates, businesses can identify overdue payments, prioritize collections, and evaluate customer payment behaviors. AR aging analysis is available in many accounting software applications, including QuickBooks, Xero, and Sage Intacct, but some companies still use Excel for a customized level of detail. Some systems may not allow for customizations with specific other calculations and visualizations. When I was in industry in a multinational company, the finance department used to get the reports out of the accounting system, but we had to do additional analysis for the offices we served. Some very small clients may also use basic or highly industry-specific software that lacks a strong accounts receivable component.
Regardless of the reason, Excel is a perfect tool to use for maintaining an accounts receivable aging report. Ideally, you run the accounts and their age from your system and then have formulas do all the work of putting them in their age buckets and summing up the total of each age bucket.
Let’s work on an example of building a dynamic AR aging schedule in Excel. If you would like to follow along, you can download this Excel workbook and access a video at the bottom of this article.
Note that the following content is based on Microsoft Excel 365 for PCs. Other versions of Excel may work differently.
We will start with a dataset that consists of our customers’ names, invoice numbers, due dates, and invoice amounts. Your system may run reports with different information, which is fine as long as it includes the due date and amounts. See the screenshot below for a snippet of our example dataset.

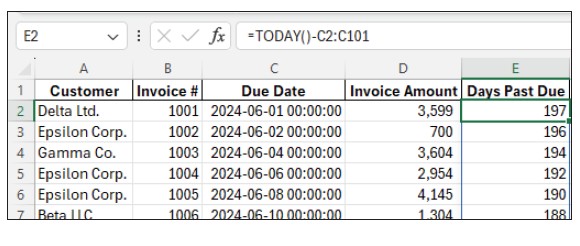
Working on the “Original” worksheet in the downloadable Excel file, create a header in cell E1 called “Days Past Due,” then enter the following formula in cell E2: =TODAY()-C2:C101. The TODAY() function will instruct Excel to determine the current date whenever you open or save the file. This formula then takes today’s date and subtracts it from the due date to determine the days past due. The result of the formula will change based on the current date, always keeping information up to date. See this formula and its results in the screenshot below.

Next, create another header in cell F1 called “Aging Bucket.” In cell F2, enter the following formula: =IF(E2:E101<=30,“0-30 Days”,IF(E2:E101<=60,”31-60 Days”,IF(E2:E101<=90,”61-90 Days”,”Over 90 Days”))). This formula categorizes each invoice based on the days past due. See the formula and its results in the screenshot below. To learn more about the IF function, check out the March 2020 Technology Q&A article “The IF Function Mastered.”

Now that all of the invoices have been categorized by age, let’s get a total for each age bucket. In cell K1, create a header called “Aging Bucket,” then list each bucket below that: 0-30 Days, 31-60 Days, 61-90 Days, Over 90 Days. This column will reference the aging bucket that we calculated in column F. Next, create a header in cell L1 called “Total Amount.” In cell L2, enter this formula: =SUMIF(F2:F101,K2:K5,D2:D101). This formula sums all the invoice amounts based on the aging bucket it was categorized into in column F. If you would like to learn more about the SUMIF function, check out the June 2020 Technology Q&A article “Reaching the SUMIF.” See this formula and its results in the screenshot below.

At this point, you have a complete AR aging schedule. However, you can set this spreadsheet up with additional features that may make the analysis more meaningful and helpful. Let’s look at some of these additional features.
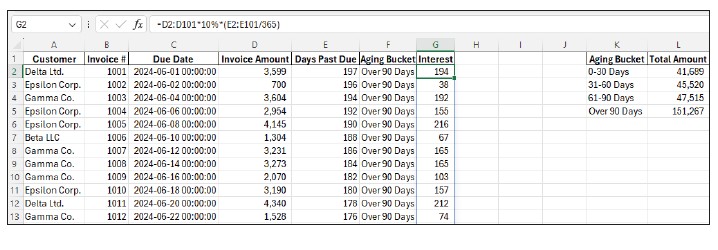
To calculate interest on overdue invoices, create a header called “Interest” in cell G1. In cell G2, enter the formula: =D2:D101*10%*(E2:E101/365), replacing 10% with whatever interest rate your company charges and replacing 365 if your company uses the common 360-day year for interest charges. See this formula and its results in the screenshot below.

From this dataset, you can do a number of analyses and visualizations. You may want to add some metrics, such as Total AR, Overdue AR, and Percentage Overdue. To do this, in cells L8:L10, insert the following formulas:
- L8: =SUM(D2:D101)
- L9: =SUMIF(E2:E101,”>0″,D2:D101)
- L10: =L9/L8
Next, place the following labels in cells I8:I10.
- Total AR:
- Overdue AR:
- Percentage Overdue:
You could also create some charts to visualize the AR aging analysis. As examples, I created a bar chart and a pie chart that clearly show the percentages of how much in each aging bucket is due. I built the charts from the data in cells K1:L4 for both.
I also inserted a simple PivotTable. To do this yourself, click somewhere within your dataset, then go to Insert on the Home tab and select PivotTable. Leave everything at its default, except select Existing Worksheet and click on cell I13 as the Location. In the PivotTable Fields window on the right side of the screen, drag Aging Bucket to the Filters area, drag Customer to the Rows area, and drag Invoice Amount to the Values area. You can change the aging bucket filter to any or all of the categories to see which clients are overdue and how overdue they are. See the charts and metrics on my completed spreadsheet in the screenshot below.

You can include other things if you think they would be helpful, such as conditional formatting on high-risk accounts and slicers to enable users to drill down into specific accounts or periods for targeted analysis. You could also use Power Query to assist with importing data into Excel.
AR aging analysis is an essential tool for managing receivables and maintaining healthy cash flow. With the right setup, AR aging analysis in Excel can transform how businesses handle receivables, ensuring a more efficient and data-driven approach to managing outstanding invoices.
About the author
Kelly L. Williams, CPA, Ph.D., MBA, is an associate professor of accounting at the Jones College of Business at Middle Tennessee State University.
Submit a question
Do you have technology questions for this column? Or, after reading an answer, do you have a better solution? Send them to jofatech@aicpa.org.


