- column
- TECHNOLOGY Q&A
Using Excel’s Scenario Manager for decision-making
This column shows how to quickly project financial possibilities with Excel Scenario Manager.
Related
Differentiating agentic and generative AI — and more with a Tech Q&A author
How AI is transforming the audit — and what it means for CPAs
Promises of ‘fast and easy’ threaten SOC credibility
TOPICS
Q. How does the Scenario Manager in Excel work?
A. Microsoft Excel’s Scenario Manager is a powerful tool for making informed financial decisions. It allows users to create and manage multiple data scenarios, providing a comprehensive platform for analyzing how changes in variables can affect overall outcomes. This functionality is particularly valuable in contexts like budget analysis, financial forecasting, risk assessment, and strategic planning. As I look back over my career, I can’t help but think how many hours this Excel feature would have saved me.
Scenario Manager facilitates “what-if” analysis by allowing users to model and compare different scenarios within a worksheet structure. Users can generate a Scenario Summary report that lists scenario names alongside their respective input and result values, as well as a Scenario PivotTable that offers an interactive summary of the data. By examining various potential outcomes through altering key inputs such as revenue, cost of goods sold, and operating expenses, accountants can gain an enhanced understanding of best-case, worst-case, and most-likely scenarios. This capability leads to improved preparedness for unexpected events and better risk mitigation strategies.
Let’s get started using Scenario Manager using an example. To follow along, download this Excel workbook. A video demonstration is available at the bottom of this article. Note that the following content is based on Microsoft Excel 365 for PCs. Other versions of Excel may work differently.
For our example, we will analyze several financial scenarios. In the Excel document, I have defined the key input variables that will drive the scenario analysis: revenue growth, cost of goods sold, operating expenses, and tax rates. We can adjust these variables and create scenarios reflecting optimistic, pessimistic, or most likely outcomes. The calculated financial metrics include gross profit, operating profit, pretax profit, and net profit.
In the Excel file you downloaded, go to Data, click the dropdown arrow next to What-if Analysis within the Forecast group and choose Scenario Manager. You will notice that within the What-if Analysis, there are also options for Goal Seek and Data Table. Goal Seek allows you to set a value for an output value and see what one input variable needs to be to make that happen. Data Table allows you to adjust two input variables simultaneously and see the impact with an output variable. Scenario Manager allows you to adjust up to 32 input variables!
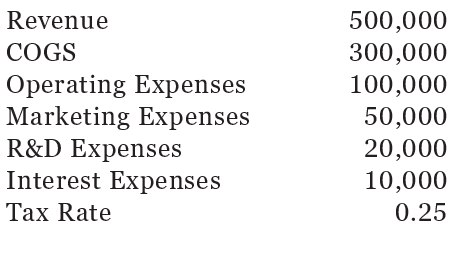
Once you click Scenario Manager, the Scenario Manager window will open, and we can add our scenarios. For this example, we are creating three scenarios: Likely Case, Best Case, and Worst Case. Click Add in the Scenario Manager window and enter the scenario name, Likely Case. Under Changing cells, enter the range B2:B8 since these are all the cells that will contain inputs that will cause changes to our various profits. The dialog box also provides an option for typing in a comment. Click OK. The Scenario Values window will open and allow you to add or change any of the values in the changing cells. For my Likely Case scenario, I chose these values:

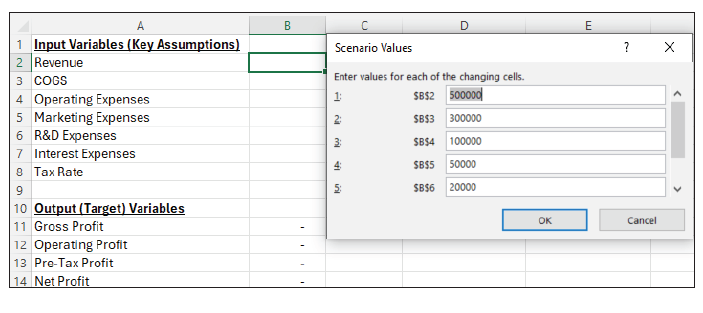
I entered these values in the Scenario Values window, but it has each variable defined by its cell reference as shown below.

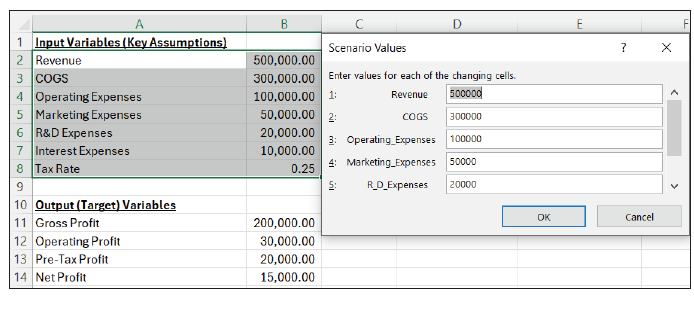
Recalling what variable is in which cell becomes even more complicated when you are reviewing it from a spreadsheet that does not contain the source data. We can name each cell, making the analysis easier to understand. Click OK, and the values will be entered in B2:B8. Simply select cells A2:B8. Go to Formulas and click Create from Selection within the Defined Names group. This opens a new window to instruct Excel to choose the names associated with the values. For this example, choose Left column since it contains the names of the values. Click OK. Below is a screenshot of my values within the Scenario Values window after naming the cells.

However, the names will be even more valuable when we compare all the scenarios, so let’s go ahead and name the output values, cells A11:B14, by following the naming instructions listed above.
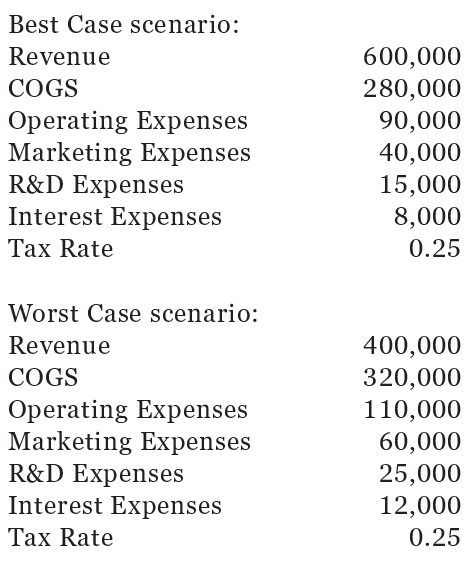
Repeat the same steps to create scenarios for the Best and Worst Case scenarios. You do not have to name the cells again.

Once your scenarios are entered, go to the Scenario Manager window, choose your scenario, and click Show. This will change your input and output variables.
Many times, it’s helpful to see your scenarios side-by-side. Open the Scenario Manager window and click Scenario summary. Choose the result cells you would like. I chose all my various profits, B11:B14. Click OK. The screenshot below shows the summary of my scenarios.

You can always go back into the Scenario Manager window and edit your values, but note that it does not update the previous summary report. You will need to run another summary report that includes the updated information.
Using Excel’s Scenario Manager significantly enhances strategic decisionmaking by enabling streamlined analysis of various potential outcomes. It also reduces time spent on manual calculations and updates, something I remember doing late into the night during budgeting season!
About the author
Kelly L. Williams, CPA, Ph.D., MBA, is an associate professor of accounting at the Jones College of Business at Middle Tennessee State University.
Submit a question
Do you have technology questions for this column? Or, after reading an answer, do you have a better solution? Send them to jofatech@aicpa.org.


