- column
- TECHNOLOGY Q&A
Discover more about your data with Ideas
Please note: This item is from our archives and was published in 2021. It is provided for historical reference. The content may be out of date and links may no longer function.
Related
Differentiating agentic and generative AI — and more with a Tech Q&A author
How AI is transforming the audit — and what it means for CPAs
Promises of ‘fast and easy’ threaten SOC credibility
TOPICS
Q. On my Excel Home tab, there is an icon called Ideas. What is this, and what does it do?
A. Considering how incredibly simple it is to use the Ideas tool, it is almost shocking how powerful it is. Ideas will analyze your dataset and give you recommendations, or ideas, for charts, PivotTables, and PivotCharts that work with your dataset. You can choose any of them to include in your workbook.
You can also ask specific questions about your data, such as:
- Which month had the highest sales?
- Which two regions produced the most units?
- Which salespeople sold more than $10,000 in March?
- What percentage of total sales occurred in the first quarter?
You have the ability to perform these powerful queries without having to use query language or formulas. Excel will also provide some suggested questions or commands based on the data. Even if you don’t have specific questions about your data, you can specify the parts of the data you are most concerned with so that Excel will narrow its suggestions to be more specific to the data most important to you.
You can access an example Excel dataset here and accompanying video for using the Ideas tool at the bottom of the page. Note that the content that follows is based on Microsoft Excel 365 for PCs. Other versions of Excel may work differently.
Ideas works best with an Excel dataset contained within an Excel table. To convert a data range to a table, click anywhere within the data and press Ctrl+T. You should also have column headers for each column within your dataset. To start using Ideas, open the Excel workbook and go to the worksheet that contains your dataset. The dataset used in the accompanying Excel workbook and video is shown in the screenshot below.

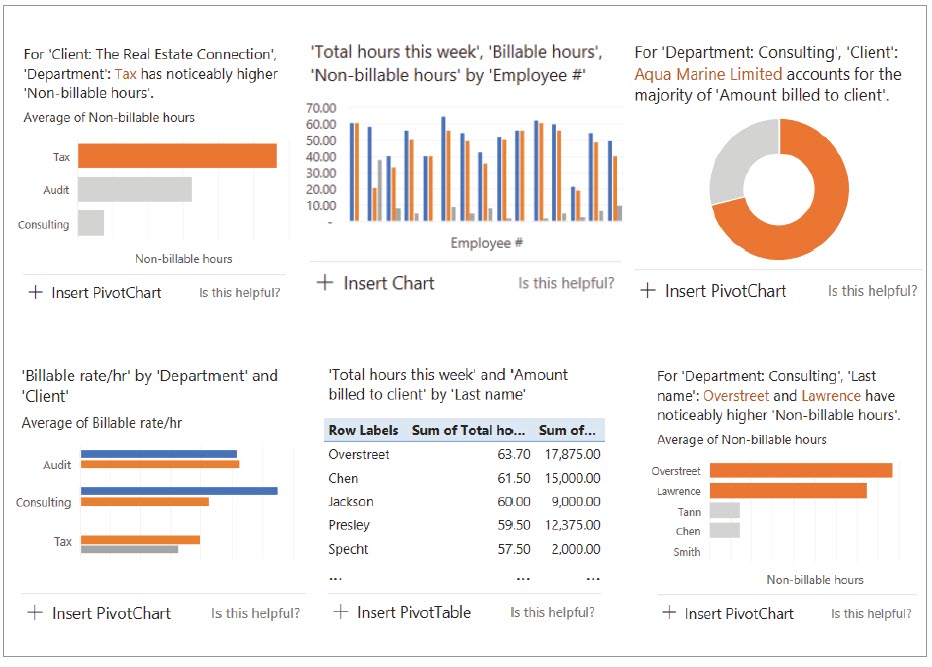
Go to Home and choose Ideas from the Ideas group. Immediately, Excel offers several charts, PivotTables, and/or PivotCharts that work with your dataset. For the dataset used in this example, Excel provided 43 ideas. A few examples of these ideas are shown in the set of screenshots below.

If you would like to add any of the ideas to your workbook, click the associated + Insert Chart, + Insert PivotTable, or + Insert PivotChart.
Another great benefit of the Ideas tool is the ability to use natural language queries to get even more information about your data without having to learn query language or use formulas. After clicking Ideas, the area at the very top of the Ideas task pane contains a box that says, “Ask a question about your data.” Simply type in a question about your data. For this example, I entered the following questions and received the corresponding responses, as shown in the three screenshots below:
- “How many employees worked on Aqua Marine Limited?”
- “Which two employees had the highest billable hours?”
- “What percentage of the total amount billed to client was from The Tool Group?”
Excel also provided a few recommended questions and commands directly under the box to ask a question, as shown in the screenshot below.

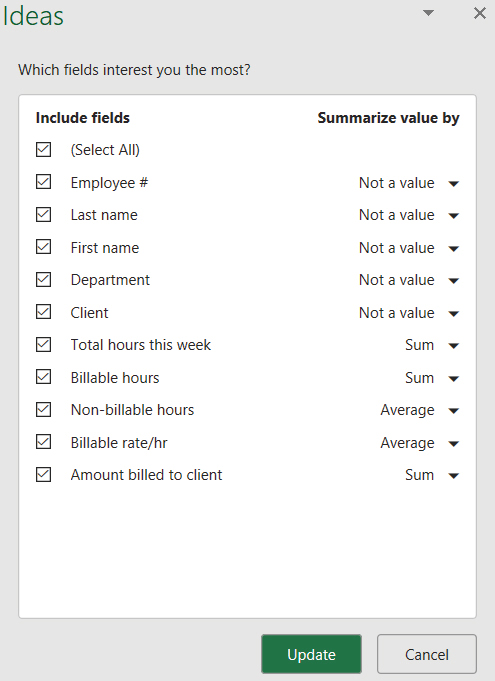
You can also customize the suggestions to focus only on the fields of particular interest to you. After clicking Ideas, click the cogwheel labeled Which fields interest you the most?, as shown in the screenshot below. A task pane will open that allows you to choose which fields to include and how to summarize their values in the ideas.
Once you make your selections, click Update, and all of the ideas and recommended questions and commands will involve only the fields of interest.

About the author
Kelly L. Williams, CPA, Ph.D., MBA, is an associate professor of accounting at the Jones College of Business at Middle Tennessee State University.
Submit a question
Do you have technology questions for this column? Or, after reading an answer, do you have a better solution? Send them to jofatech@aicpa.org. We regret being unable to individually answer all submitted questions.


