- column
- TECHNOLOGY Q&A
Obtain a Distinct Count
Please note: This item is from our archives and was published in 2020. It is provided for historical reference. The content may be out of date and links may no longer function.
Related
Differentiating agentic and generative AI — and more with a Tech Q&A author
How AI is transforming the audit — and what it means for CPAs
Promises of ‘fast and easy’ threaten SOC credibility
TOPICS
Q. I have a large spreadsheet that includes company codes with multiple group segments for each company. Many of the group segments within the same company are repeated. Is there a way to quickly determine how many group segments there are for each company, because my spreadsheet has thousands of lines with many companies?
A. This can be done easily with a basic PivotTable. Based on your question, I have created a simplified example to illustrate. Click here to access the accompanying spreadsheet and watch a video walkthrough at the bottom of the page.
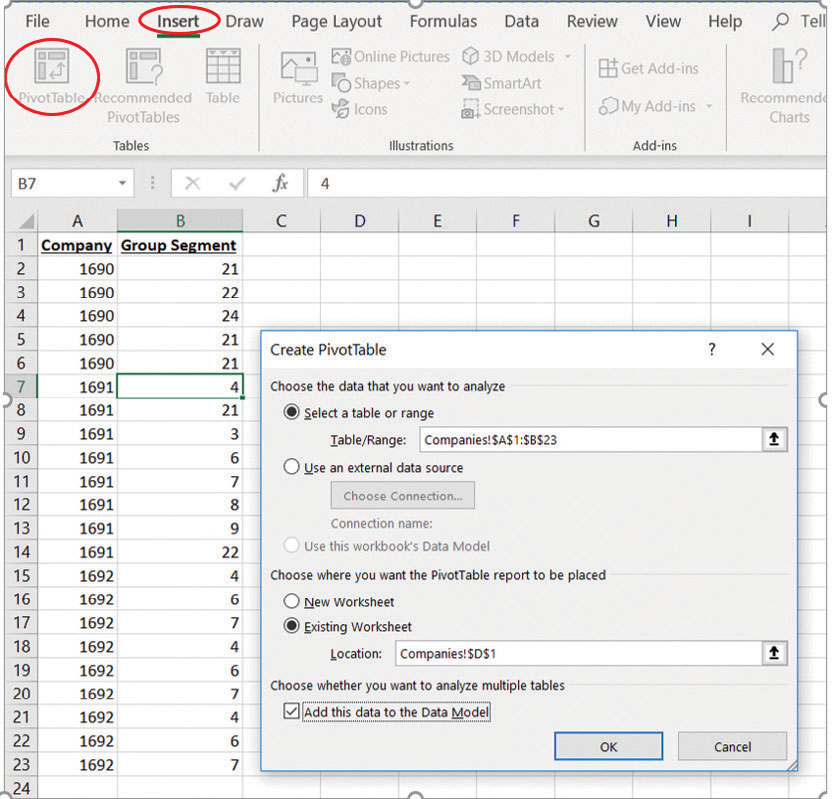
As you can see in the screenshot above, Company 1690 has five entries in the spreadsheet and three group segments (with Group 21 listed three times). Similarly, companies 1691 and 1692 also contain multiple group segments.
How can you quickly calculate the number of group segments per company? To start, click anywhere within your data, go to the Insert tab on the top navigation bar, and select PivotTable from the Tables group, as shown in the screenshot above.
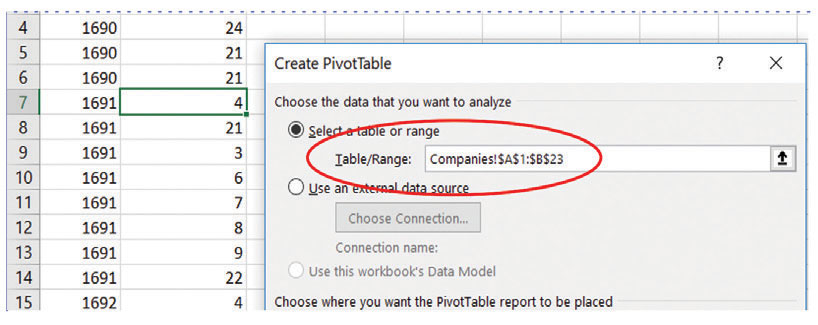
If you had previously clicked within your data, the entire range should already be selected in the Table/Range area in the Create PivotTable window, as shown in the red circle in the screenshot below.
By default, Excel will create your PivotTable in a new worksheet. You can accept that option or choose Existing Worksheet to have the PivotTable placed on the existing worksheet. If you chose Existing Worksheet, click in the cell in which you would like the PivotTable to appear. That will fill in the Location, as shown in the screenshot below.

Next, click the option next to Add this data to the Data Model, as shown in the screenshot below. This gives us some additional options we will need.

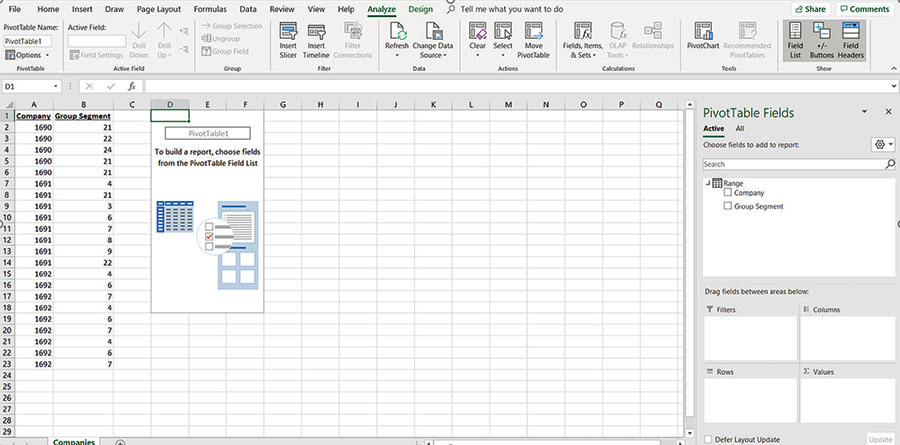
Click OK, and Excel will create a PivotTable shell to begin building the PivotTable itself. A PivotTable Fields area should open on the far-right side of your screen, as shown in the screenshot below. If the PivotTable Fields area does not open automatically, click on Analyze at the top of the screen, and click Field List from the Show group.
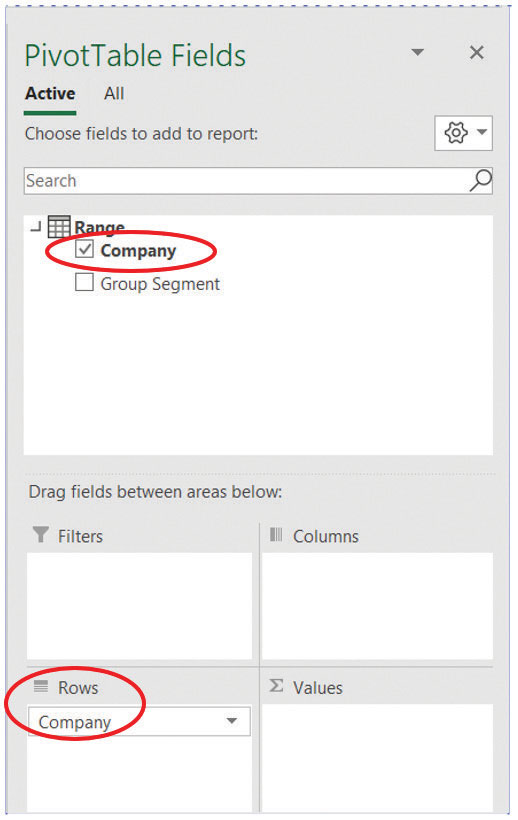
We would like to determine the number of group segments within each company. To do this, click and drag the word “Company” in the PivotTable Fields area down to the Rows area, as shown in the screenshot below.
Next, click and drag the words “Group Segment” in the PivotTable Fields area down to the Values area, as shown in the screenshot below.
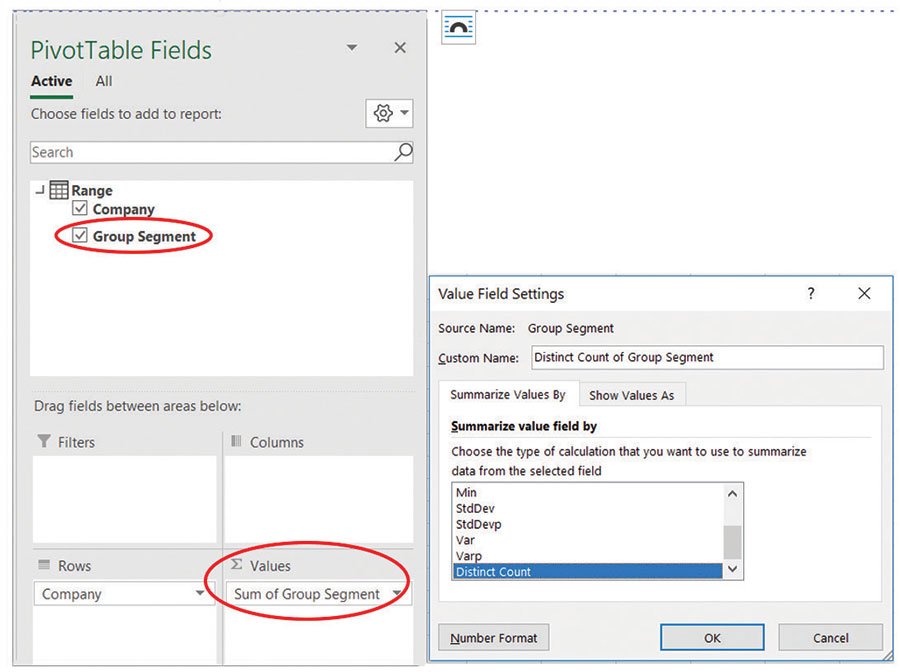
When you drag “Group Segment” into the Values area, by default Excel will create a Sum of Group Segment. We want a Distinct Count instead. Click the drop-down arrow next to Sum of Group Segment and choose Value Field Settings from the resulting pop-up menu. That will open the Value Field Settings dialog box, pictured to the right above. Under Summarize value field by, choose Distinct Count. If you had not previously checked Add this data to the Data Model, you will not have Distinct Count as an option. Click OK.

You should now have a list of all companies and the number of distinct group segments within each company, as shown above.
About the author
Kelly L. Williams, CPA, Ph.D., MBA, is an assistant professor of accounting at Middle Tennessee State University.
Submit a question
Do you have technology questions for this column? Or, after reading an answer, do you have a better solution? Send them to jofatech@aicpa.org. We regret being unable to individually answer all submitted questions.


