- newsletter
- Extra Credit

See descriptive statistics in Excel
Please note: This item is from our archives and was published in 2021. It is provided for historical reference. The content may be out of date and links may no longer function.
Related
Add the Data Analysis ToolPak to Excel
Excel’s Analysis ToolPak allows users to do a wide variety of more advanced data analysis. One function it offers is a tool that can quickly calculate a series of basic descriptive statistics for a dataset, including mean, standard deviation, minimums, and maximums.
Using the Descriptive Statistics tool
Find the Descriptive Statistics tool by clicking on Data and then Data Analysis in the ribbon. (Note: If you don’t have the Data Analysis option, you will need to install the Analysis ToolPak add-in. See our previous article on how to do this.)

A new box will open, allowing you to select which analysis tool you would like to use. Select Descriptive Statistics and then OK.

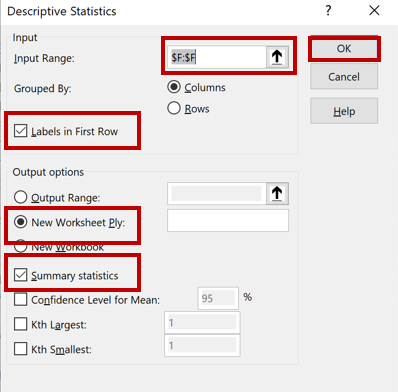
Next, identify the input range of the data that you want to perform the descriptive statistics on. In the example below, I’ve selected Column F (the transaction amount). If your data includes labels, you should check the box titled Labels in First Row. Then, identify where you want your output to appear (such as a new worksheet or new workbook) and ensure that the Summary statistics box is checked. Click OK.

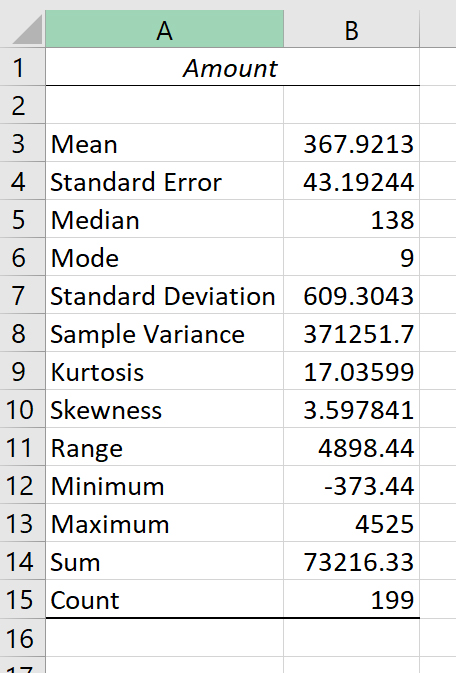
You will now see a variety of descriptive statistics (such as mean, median, standard deviation, minimum, maximum, and count) about your data.

— Wendy Tietz, CPA, CGMA, Ph.D., is a professor of accounting at Kent State University in Kent, Ohio; Jennifer Cainas, CPA, DBA, is an instructor of accountancy at the University of South Florida in Tampa; and Tracie Miller-Nobles, CPA, is an associate professor of accounting at Austin Community College in Austin, Texas. See their site AccountingIsAnalytics.com for resources they have developed for teaching data analytics in introductory accounting. To comment on this article or to suggest an idea for another article, contact JofA senior editor Courtney Vien at Courtney.Vien@aicpa-cima.com.


