- news
- FINANCIAL REPORTING
Where Do Investors Prefer to Find Nonfinancial Information?
Please note: This item is from our archives and was published in 2010. It is provided for historical reference. The content may be out of date and links may no longer function.
Related
Why planning to work longer may be the better path to retirement
SEC eyes e-delivery as the default over paper
From estate planning to AI: Managing CPA liability
It’s no secret to investors that annual reports filed by U.S. companies are becoming increasingly complex. Many reports in the business press over the past decade cite concern that the proliferation of required disclosures accompanying financial reports makes it difficult to decipher a company’s performance and identify factors that drive performance.
We recently tracked the information used by professional and retail investors to examine how they cope with this complex information environment. In this article, we use the data to provide answers to some key questions. How much of the information in an annual report do investors use in making their investment decisions? How do investment professionals such as financial analysts differ from retail investors? If they have a choice about where to find specific types of information (that is, in the financial statement footnotes or in other sections of the annual report), which location do they prefer?
Our findings have implications for investor decision-making, as well as for current efforts to simplify financial reporting and to enhance the relevance of business reporting through improved disclosure via important channels beyond the face of the financial statements themselves, such as Management Discussion & Analysis (MD&A).
INFORMATION COMPLEXITY AND THE FINANCIAL MARKETS
These issues are important for two reasons. First, U.S. corporations that prepare financial reports have long expressed concern about the growing complexity of required disclosures. Essentially, many in the business community who support simplification of financial statements and related disclosures are concerned about the increasing costs of preparing required disclosures and the effects of the resulting “information overload” on investor decision quality.
The SEC recognized the importance of this issue during the proceedings of the Advisory Committee on Improvements to Financial Reporting. This committee’s charge focused on ways to reduce unnecessary complexity, making information more useful and understandable to investors. FASB announced on July 8, 2009, that it was following up with a new disclosure framework project to address the “disclosure overload” and to “help eliminate redundancy or otherwise outdated GAAP disclosure requirements.” However, there is little evidence on how investors actually do use information in their investment decisions. This article addresses that issue.
Second, nonprofessional investors form a significant proportion of the market. While the era of the “day trader” may have passed, many individuals manage their own retirement accounts and make buy/sell decisions. While many nonprofessional investors have years of experience in trading stocks, most lack the education of financial professionals. Does the information they acquire when reviewing an annual report imply differences in the ways in which they make investment decisions? Do any differences in information use suggest disadvantages that might inhibit the performance of their portfolios, relative to investment professionals? We address these questions by comparing information use between the two groups.
OUR PROCEDURES FOR MEASURING INVESTORS’ USE OF INFORMATION
Our study on these issues involved data from 73 investment professionals and 118 nonprofessional investors, who were provided with an annual report (Form 10-K) adapted from the annual report of a public U.S.-domiciled high-tech company, and asked to make investment decisions using their normal practices.
The investment professionals came from a variety of financial advisory roles, including both buy-side and sell-side analysts. Our criteria for professionals included experience in evaluating information for equity valuation; thus, the sample includes financial analysts, venture capitalists, brokers and financial advisers.
The retail investors had on average 10 years of personal investing experience. Criteria for inclusion of nonprofessionals included income greater than $75,000 and availability of assets greater than $50,000 for investing.
While we based case materials on an actual company for realism, we disguised the company’s identity (that is, its name and the names of personnel and products) to prevent participants from looking up the actual stock price from public sources. Participants responded to the case using a dedicated website, clicking on links to access information they wanted to consider in judging the risk of the company and predicting its future stock price. The information categories were listed in a table-of-contents fashion down the left side of the web page, providing a format very similar to that provided in a PDF format 10-K document. Software tracked the information they accessed.
As with an actual annual report, company information included the following major categories: Financial Statements, Financial Statement Footnotes, the Independent Auditor’s Opinion, MD&A, Business Data and Risk Factors, and Other Required Information. Within each category were individual components (for example, there were 21 footnotes). In addition, we included summary information regarding ratios and trends from the actual company’s website as most investors are likely to have a baseline knowledge of a company’s past performance when evaluating an annual report.
WHAT INFORMATION DO INVESTORS USE?
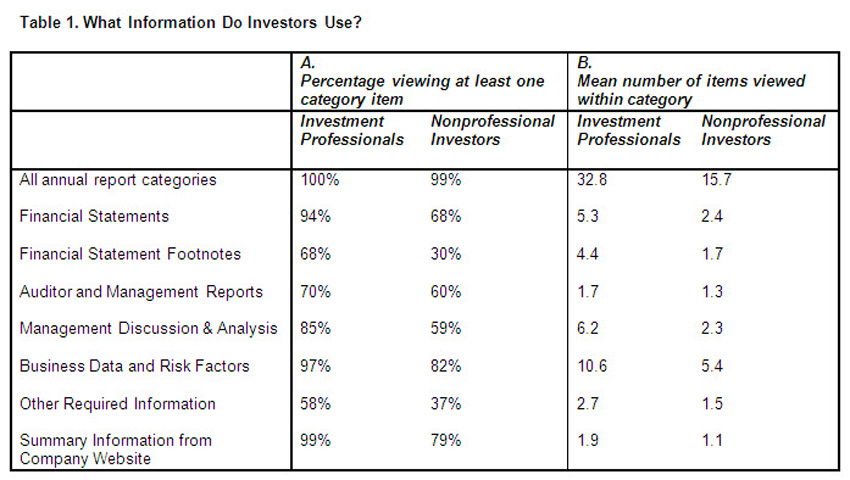
We first consider the annual report as a whole, and ask how much information is used by our investor groups, and what type of information they prefer to examine. Table 1 shows the percentages of professional and nonprofessional investors who viewed at least one item in the category (Column A), and how many times they viewed individual components of the category (Column B). Several trends are evident. First, while virtually all investors viewed some annual report information prior to making their predictions, the extent of use varies across categories. Most heavily used are Business Data and Risk Factors (for example, 97% of professionals), Financial Statements (94%), and the MD&A (85%). Interestingly, virtually all professionals viewed summary ratio and trend information taken from the actual company’s website, which is outside of the annual report.
Second, use of all categories of information is lower among retail than professional investors. This implies that nonprofessionals make their investment decisions with less knowledge about the company’s performance, and that the quality of their decisions could be impaired. Differences are particularly large in the financial statement and footnotes categories. Because these are the audited parts of the annual report, they are perhaps the most reliable, although also likely the most difficult to understand without business training.
A third key conclusion to be drawn from investors’ information use is that there is great variability in use of individual items within information categories and that investors do not use footnote information extensively. For example, Table 1 shows what information the different types of investors view when evaluating a company.It shows that 68% of professionals viewed at least one of the 21 footnotes, but only 30% of nonprofessionals viewed at least one.
Further analysis not included in Table 1 indicates that 12 of the 21 footnotes were viewed by fewer than 20% of professional analysts. The highest percentage of professionals viewing any single footnote was 37% (the disclosure of “subsequent events”). Nonprofessionals used even less footnote information. Fourteen of the 21 individual footnotes were viewed by fewer than 20% of the nonprofessional participants. These results imply little agreement among our investor groups about which footnotes are most important, which does not provide a good roadmap to policy groups trying to reduce disclosure complexity.
WHERE DO INVESTORS LOOK FOR INFORMATION WHEN THEY HAVE A CHOICE?
Our discussion in the previous section suggests that if investors do not view particular information, they may miss elements of company performance that could be useful in making investment decisions. However, a good deal of information is contained in multiple sections of the annual report, providing the opportunity to examine investors’ choices. When similar information is available in alternative locations, what location do investors choose, and does this vary between professional and nonprofessional groups? One reason this is an important and interesting question is that some sections of the annual report are audited (the financial statements and related footnotes), while other sections are only reviewed by the company’s independent audit firm.
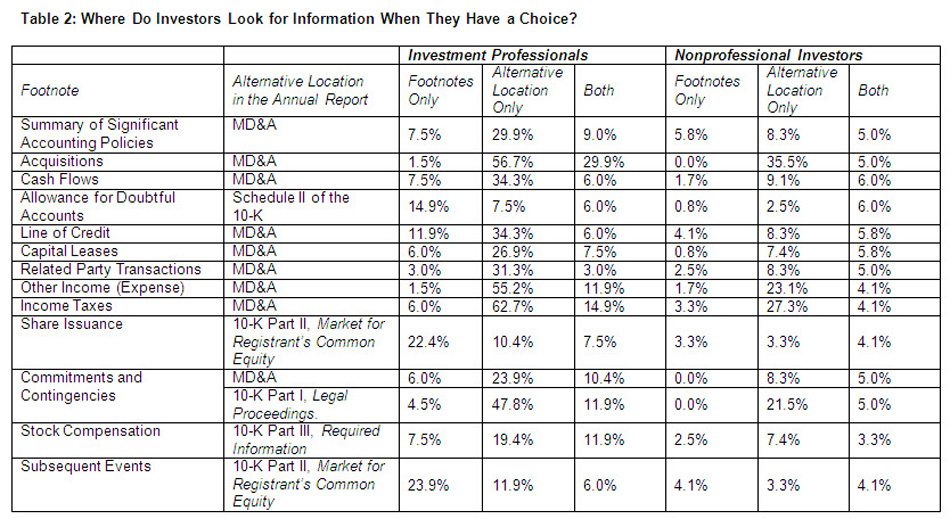
Table 2 lists some items that are contained in more than one section of our subject company’s annual report. The table shows what percentage of professional and retail investors chose to view the information in the footnotes, or in an alternative location. For most items, the predominant choice is to view the information outside of the footnotes. For example, 1.5% of professionals viewed information on corporate acquisitions in the footnotes, but 56.7% viewed that information in the MD&A.
Similarly, no nonprofessional investors viewed footnote information on corporate acquisitions, but more than 35% examined that information in the MD&A. These comparisons suggest a preference for obtaining company information in the MD&A over the same information in the financial statement footnotes. This is important in light of the SEC’s ongoing deliberations as to whether disclosures in the MD&A should be extended.
CONCLUSIONS AND IMPLICATIONS
Our results indicate that on average, retail investors come to the task of predicting future company results with a much smaller set of information than professionals. Further, professional and nonprofessional investors differ substantially in their extent of using specific categories of the annual report information. This trend is especially evident for financial statements and the related footnotes, which provide key detail on account activity and financial reporting methods. This implies that nonprofessional investors are at a disadvantage in making investment choices, as they are less informed about results of operations at a detailed level and about earnings quality.
Our results also show that within both professional and nonprofessional investor groups, financial statement footnotes are accessed less than other information categories in the annual report, even when the same information is provided in both sections.
There are several possible explanations that our data cannot distinguish, which have different implications. One explanation is that investors may perceive that the footnotes are too complex. If so, that would support calls to reduce the extent of required footnote disclosures. However, our investor participants do not show a consensus on which footnotes are most important, providing little guidance to the simplification effort. Alternatively, they may prefer to consider information items within the context or “story” that management portrays about the company in the MD&A. This implies that investors prefer to use information that has a lower level of assurance. While footnotes are audited under current requirements, the MD&A has only review-level assurance. Extension of the audit to the MD&A and other sections of the annual report may be desirable in light of the information usage patterns observed in this study.
TABLES
- Table 1: What Information Do Investors Use?
- Table 2: Where Do Investors Look for Information When They Have a Choice?
Acknowledgements: This research was made possible by a grant from the FINRA Investor Education Foundation. The authors are also grateful for the Enhanced Business Reporting Consortium members’ feedback on the design and support of the research activities, the financial institutions that provided professional participants, and to the professional and nonprofessional investors who gave their time in support of our research.
More from the JofA: