Detecting anomalies with Benford’s Law in Excel
Q. How can I use Benford’s Law in Excel?
A. Benford’s Law is a powerful tool in the accounting and auditing profession. It is based on the observation that in many naturally occurring datasets, the first digits are not uniformly distributed from 1 through 9. Instead, smaller digits like 1, 2, and 3 appear as the leading digit more frequently than larger digits like 8 or 9. The same rule applies for subsequent digits, but let’s focus on the first digit for this walk-through.
Based on Benford’s Law, the first digit in a number should be 1 about 30.1% of the time, while 9 should appear first only about 4.6% of the time. Because one might assume digits 1 to 9 would appear as the leading digit at around the same rate in a uniform distribution, this pattern may seem counterintuitive. However, nonrandom digit distribution has been confirmed across many datasets, including populations, financial transactions, electricity bills, and scientific constants.
This phenomenon has important implications for fraud detection and forensic accounting and can be used to reveal journal entry irregularities.
In accounting and finance, data often follows Benford’s distribution. When fraudulent activity occurs, perpetrators tend to create numbers that deviate from this natural pattern. For example, an employee manipulating expense reimbursements may choose round numbers or repeat certain digits more often than expected. Thus, Benford’s Law can serve as a red flag tool. It doesn’t prove fraud, but it highlights areas that may warrant further investigation.
Let’s apply Benford’s Law to a dataset in Excel to see how to do it and how to interpret the results. To follow along, you can download an Excel file with the dataset used in this article. A video demonstration of using Benford’s Law to detect anomalies in Excel is available at the end of this item.
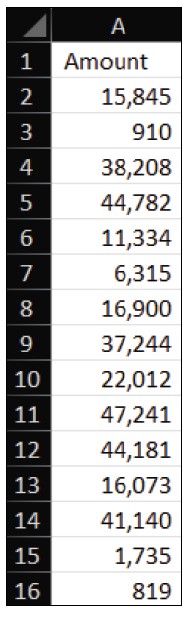
Below is a snippet of column A, showing the dollar amounts from the transactions I want to review for anomalies.
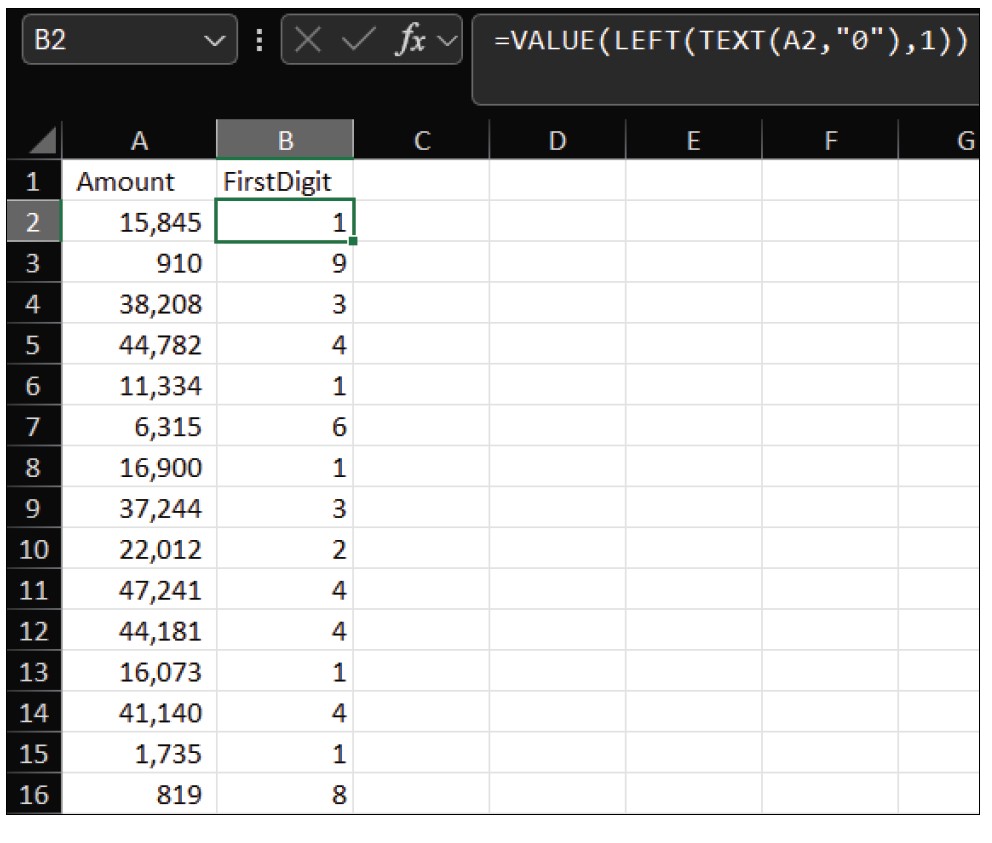
To apply Benford’s law, start by extracting the first digit of each dollar amount. In cell B2, enter the formula =VALUE(LEFT(TEXT(A2,”0″),1)). This formula converts the number to text, extracts the first character, and converts it back into a numeric value. Drag that formula down so that the first digit of each dollar amount appears to the left of that amount in column B. Your spreadsheet should look similar to the following screenshot.
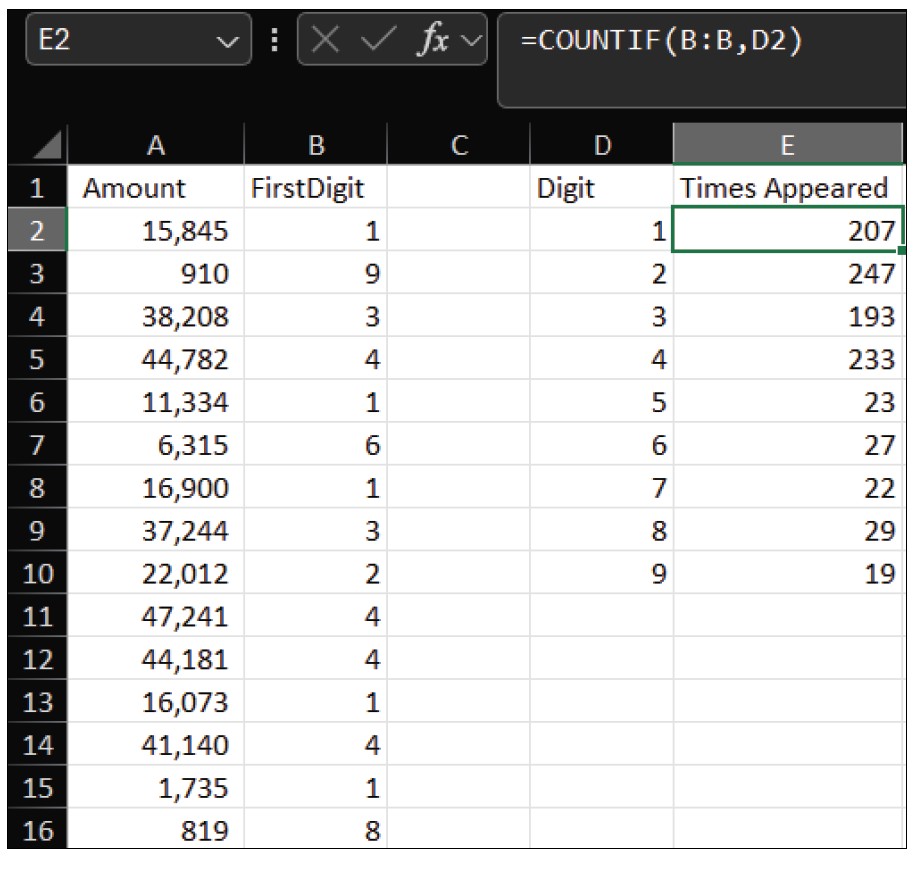
Next, create a table of digits 1 through 9 in Column D, starting in cell D2. In Column E, use COUNTIF to count how many times each digit appears. In cell E2, enter the formula =COUNTIF(B:B,D2), then drag it down to cell E10. Your spreadsheet should look similar to the screenshot below.
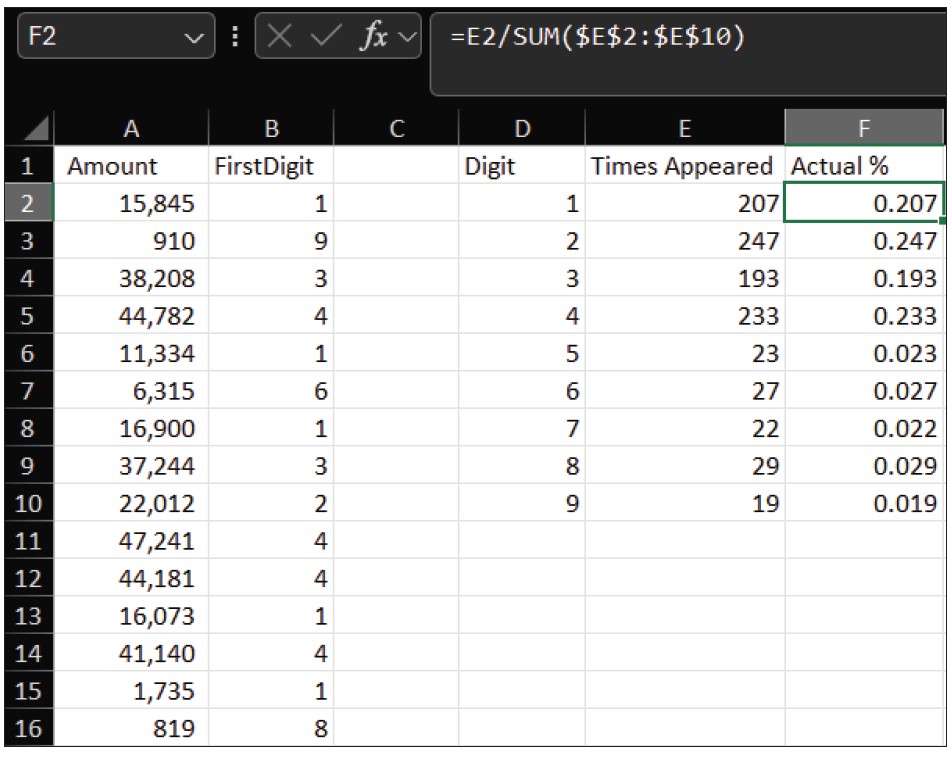
Next, you need to calculate the percentage frequency of each digit. In cell F2, enter the formula =E2/SUM($E$2:$E$10) and drag it down to F10. Your worksheet should look like the one in the following screenshot.
Now, you need to enter into column G the expected percentages based on Benford’s Law.
1 = 30.1%, 2 = 17.6%, 3 = 12.5%, 4 = 9.7%, 5 = 7.9%, 6 = 6.7%, 7 = 5.8%, 8 = 5.1%, 9 = 4.6%.
Visualization of the data makes it easier to spot deviations between the actual distribution of the first digits and Benford’s distribution, so it is helpful to create a chart. Select the data in columns D, F, and G, including the headers. Go to the Insert tab on the ribbon, select Combo in the Charts group, then Create Custom Combo Chart. Set Actual % to Clustered Column and Benford % to Line. Make sure the secondary axis is off. Label your axes and chart title, and make any other formatting changes you prefer. Your chart should look similar to the one in the screenshot below.
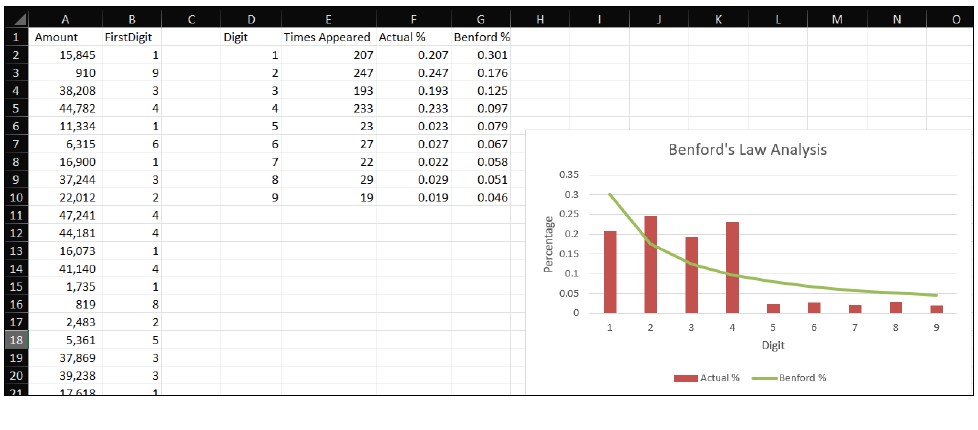
If your data closely follows Benford’s distribution, it is likely free of manipulation. Significant deviations, however, highlight areas worth investigating further. Remember, though, that not all datasets follow Benford’s Law; for example, prices set at $9.99, regulatory thresholds, or capped expenses may naturally deviate.
About the author
Kelly L. Williams, CPA, Ph.D., MBA, is an associate professor of accounting at the Jones College of Business at Middle Tennessee State University.
Submit a question
Do you have technology questions for this column? Or, after reading an answer, do you have a better solution? Send them to jofatech@aicpa.org.


