- feature
- PROFESSIONAL ISSUES
MAP Survey shows firms on upward trajectory
Benchmarking study finds revenue and profit growth, also identifies areas where accounting practices could bolster their appeal for talent.

Related
Getting unstuck by rethinking processes, people, and AI
How a CPA beat burnout after strokes, years of depression
Don’t let a bankrupt client bankrupt you
Accounting firms, buoyed by a bottom-line bounce, posted positive results in many metrics during 2022. The numbers also show room for improvement and point to tweaks CPA practices could employ to make themselves more attractive to talent.
Those are just a few of the takeaways from the 2023 National Management of an Accounting Practice (MAP) Survey, which is conducted by the AICPA’s Private Companies Practice Section (PCPS) and CPA.com every two years.
The MAP Survey is the largest benchmarking survey of public accounting firms. The 2023 survey, fielded from mid-May until mid-July, collected financial, staffing, and other results for the 2022 fiscal year. The number of firms completing the survey increased to 1,117, up from 1,065 for the 2021 survey, which reported fiscal 2020 results.
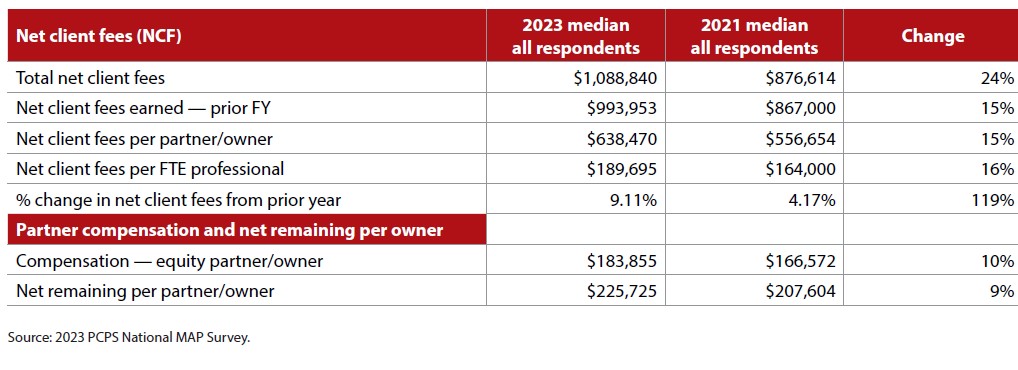
The 2023 survey found that median total net client fees for all firms in 2022 reached almost $1.1 million, a 9.1% jump year-over-year from 2021. That increase was more than twice the 4.2% reported in the 2021 survey and a sign that firms picked up positive bottom-line momentum during the final full year of the COVID-19 pandemic.
The same pattern was seen across all seven firm size categories tracked by the MAP Survey. The year-over-year gain in median total net client fees at least doubled in all but one of the categories, with the smallest firms posting the largest increases.
Full MAP Survey results are available on the AICPA & CIMA website. PCPS firms that participate in the survey can access the survey platform, where they can simultaneously filter multiple attributes with a single query and compare the results in myriad ways, including by region and firm size. An executive summary covering the survey results, including a breakdown by firm size, was to be published by Oct. 1. This article focuses for the most part on results for all firms.
TRENDING IN THE RIGHT DIRECTION
Total net client fees (see the box “Glossary of MAP Survey Metrics”) is the only metric for which MAP respondents are asked to provide prior-year data. On all other data points, the 2023 and 2021 surveys may represent different sets of firms based on participation. With the increasing number of firms participating in the survey, however, the volume of data confers validity to general trends seen in the results, particularly when considered for all respondents.
With this view, the 2023 results showed firms headed in the right direction in several areas, including net client fees. In addition to a 24% survey-tosurvey jump in total net client fees, firms also posted double-digit percentage increases for median net client fees per partner/owner (up 15% from the 2021 survey) and net client fees per FTE professional (up 16%). The results also revealed increases in median net remaining per partner (a measurement of firm profit) and median compensation per partner. (See the table “Fees, Compensation, and Profit on the Upswing, below.”)
Fees, compensation, and profit on the upswing

As would be expected given the gains on the top and bottom lines, firms reported median higher hourly billing rates. Across all positions, the median net hours billing rate rose 16%, but other metrics indicate firms could charge more.
“It’s encouraging to see so much change in the right direction since the last survey, especially with the increases in salaries and the bottom line,” said Erin Hartman, CPA, manager-firm services and the MAP Survey leader for PCPS.
Realization for all firms jumped to 99%, up from 97% in the previous survey. The rising realization rate hints at firms being resistant to rate increases, perhaps due to fear of a downtick in this metric, but the fact that the realization rate is almost maxed out may indicate that billing rates are too low relative to market position.
An overemphasis on realization also may be a factor in firmwide utilization dipping to 59.6% from 62.3%. Employees at firms that stress high realization rates may be disposed to under-record billable time. Either way, firms may be leaving money on the table that they could access by raising their prices further and faster.
ON THE TALENT FRONT
The Wall Street Journal, citing U.S. Bureau of Labor Statistics data, made headlines with its report Dec. 28, 2022, that more than 300,000 accountants and auditors had left their jobs in the previous two years. That represented a 17% decline in the total number of accountants and auditors in the U.S.
The staffing numbers in the MAP survey are not nearly as dramatic or negative. That is due in part to the MAP Survey reporting median results. Because averages can be skewed by outlier results, the MAP Survey selects the data point in the middle of all the responses for each line item. In the case of turnover, the median rate of 0% means that more than half of all firms reported no turnover, not that there was no turnover at all.
This is illustrated with the three largest groups by firm size. More than half the respondents in each group reported turnover, and those results pointed to turnover increasing with firm size. The survey found a median turnover rate of 6% for firms with annual net client fees of between $1.5 million and $5 million. Firms in the $5 million to $10 million range reported a median turnover rate of 10% while the largest firms ($10 million and up) saw their median turnover rate hit 14.25%.
As for the four smallest groups by firm size, not every firm reported 100% retention but the overall numbers and discussions with firm partners point to fewer professionals leaving their jobs.
“Interacting with small firms this spring and this year, retention was truly much better than in the past,” said Carl Peterson, CPA, CGMA, vice president – Small Firm Interests, AICPA & CIMA, together as the Association of International Certified Professional Accountants.
Among firms that reported voluntary turnover, 30% of them had a team member accept a position at another firm and 28% had a team member leave the profession entirely. Those percentages were up from 19% and 20%, respectively, in the 2021 survey. The percentage of firms hit with retirements crept up to 19% from 15% two years ago.
MONEY TALKS
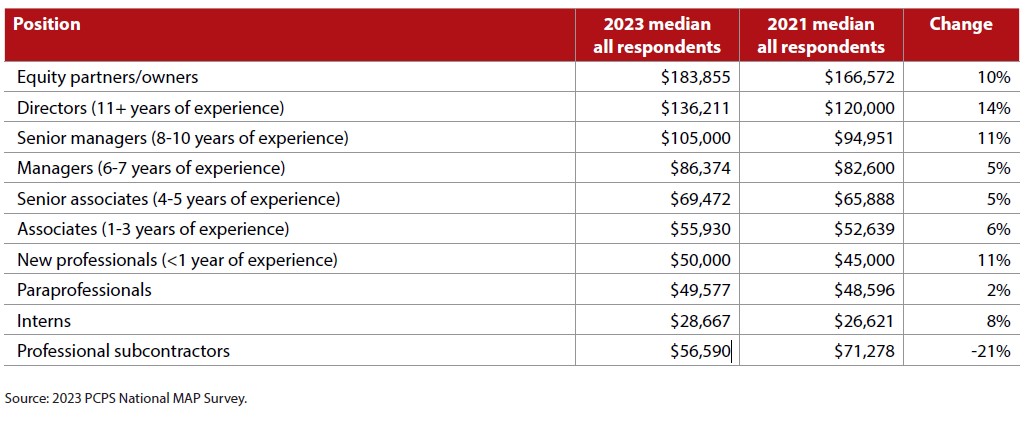
Salaries viewed as low compared to other professions have been cited as one of the reasons more accountants are leaving the profession and fewer students are going into accounting. Firms responded with a median annual average base salary compensation increase of 6.1%, up from 4% in the 2021 survey but short of what may be needed to boost retention.
Average compensation did grow by double digits for new professionals and for senior managers, directors, and equity partners, though the $50,000 average salary for new graduates and first-year professionals must climb to measure up against other professions. Firms also should consider larger increases in compensation for associates through managers. The median salary jumps for those positions failed to exceed 6% and may be a reason that firms have struggled to add talent with two to seven years of experience. (See the table “Average Compensation Per Position,” below.)
Average compensation per position

The metrics indicate firms have increased rates enough to cover the salary increases they have enacted, while the high realization rates noted in the previous section indicate that firms could continue to raise rates to cover further increases in salary.
Money isn’t the only way to woo and retain talent. Firms have several other moves they can make to offer their staff more resources, more flexibility, and more interesting work.
VIEW FROM THE TOP (PERFORMERS)
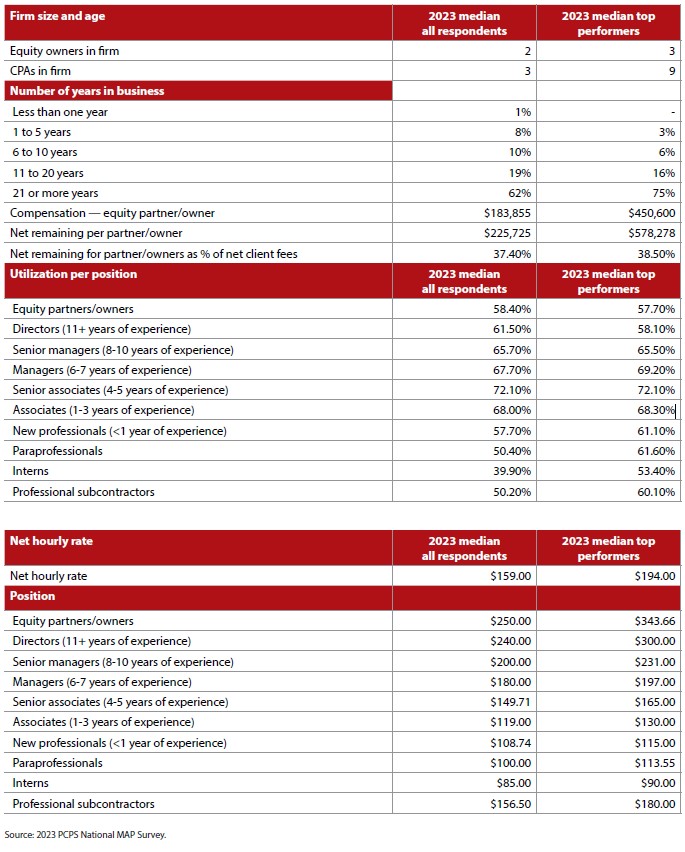
Some of these opportunities are highlighted when comparing all firms to the top performers, identified as the 25% of respondents with the highest net remaining per partner. The median top performer has more partners and staff and has been in business longer than the median survey respondent. They also charge higher billing rates and provide higher compensation for partners and staff. (See the table “Top Performers vs. All Respondents,” below.)
Top performers vs. all respondents

One of the biggest differences between top performers and all firms shows up in firm leverage ratio, a metric added to the survey this year. Top performing firms posted a median firm leverage ratio of 5.5, compared to 1.6 for all firms. As a result, top performers do a better job of shifting work to lower levels of the firm, as evidenced by a higher median utilization rate for new professionals and associates.
Top performers are also more likely to:
- Employ operations staff — Top performers had a median 10 FTE operations employees, compared to 3.5 for all firms. Top performers also had more operations staff in client-facing positions. The more people in place to help with everyday tasks, the more capacity the firm will have for more value-added services.
- Cull clients — 73% of top performers currently do so, compared to 62% for all firms. In addition, 90% of top performers plan to shed clients going forward, compared to 83% of all firms. By disengaging with clients that are difficult or inefficient to work with, or otherwise not a good fit, firms can reduce staff stress through a more manageable workload and more enjoyable client relationships.
- Outsource work — Half of top performers plan to outsource domestically in the future, and 52% plan to use offshore workers. That compares to 43% and 37% of all firms, respectively. Outsourcing can shift lower-level tasks away from in-house staff, freeing them to devote time to more rewarding work.
- Make more money outside of individual tax compliance work — Top performers that offer business compliance and planning service fees posted higher median service fees in that category than top performers recorded for individual tax compliance and fees. While the median annual service fees for individual tax was roughly three times higher for top performers than for all firms, the business tax and client accounting/advisory services (CAS) medians were almost four times higher than those produced by all firms. The expansion into higher-margin service lines creates additional opportunities for staff to do more interesting work, work fewer hours, and make more money.
OPPORTUNITIES FOR IMPROVEMENT
A dive into the MAP Survey results uncovered a few areas where all firms, including top performers, could improve their standing with talent.
Consider pricing and billing methodologies. For all firms that offer value pricing, the percentage of revenues delivered through that method grew to 25% from 22%. The percentage of revenues from hourly billing dropped to 65% from 70%. Interestingly, top performers reported 20% of revenues from value pricing and 65% from hourly billing.
Firms likely will have to lean increasingly on value pricing as artificial intelligence and other technological advancements continue to automate and otherwise reduce exponentially the number of hours needed to complete certain tasks. This will force practitioners to focus on the true value they are providing and not the hours they are putting in. The value to the clients will be in the expertise, not the time.
Technology expertise also could present opportunities for firms to get young professionals involved in more meaningful work early in their careers, heightening the odds of retention.
There is also room for improvement in getting more non-accountants involved in client-facing tasks. Non-accountants can help with client management, administrative tasks, and other nonaccounting client needs, freeing up accountants for higher-level work. About 60% of all firms and top performers currently have non-accountants working with clients, but 33% of all firms, and 30% of top performers, have no plans to do so.
LOOKING FORWARD
Hartman, the MAP survey leader for PCPS, challenged firms to compare their results to the MAP results and find a couple of areas to seek improvement.
“We want to encourage firms to explore enhancing their service lines, which can lead to updated billing practices, improved and more evenly spread cash flow, reduced typical ‘busy season’ hours, and new challenges for staff who want to grow,” she said. “This can be a true win-win for staff, owners, and client.”
Glossary of MAP Survey metrics
The following are definitions of key MAP Survey metrics and how they are calculated:
- Net client fees = Gross fees for services + writeups – writedowns. It is a net revenue measure.
- Net remaining = Net client fees – expenses before partner compensation or draws. It is a profit measure.
- Realization: Net client fees ÷ gross client fees
About the author
Jeff Drew is editor-in-chief of the JofA.
LEARNING RESOURCES
With nine tracks of expert content, you’ll gain exclusive insights, develop practical skills, and walk away with tangible guidance to evolve at your own pace.
June 3-6, 2024, Las Vegas
CONFERENCE
The profession’s resource for timely and critical information which includes real-time interpretation and analysis, along with a broader discussion on strategies and capabilities to drive longterm success. Town Hall contributors include practitioners, thought leaders, regulators and lawmakers, and a range of experts from across the profession, government, and business.
WEBCAST
For more information or to make a purchase, go to aicpa-cima.com/cpe-learning or call the Institute at 888-777-7077.
AICPA & CIMA RESOURCES
Articles
“4 Steps to Building a Successful CAS Practice in a Traditional CPA firm,“ JofA, Nov. 28, 2022
“Attributes of Top-Performing Firms Revealed,“ JofA, Feb. 1, 2022
“When and How to Raise Fees at Your Firm,“ JofA, Jan. 1, 2022
Tools


