- feature
- TECHNOLOGY
Data preparation for CPAs: Extract, transform, and load
ETL processes unearth the fuel needed to power the analytics and visualizations that unlock business insights.
Please note: This item is from our archives and was published in 2020. It is provided for historical reference. The content may be out of date and links may no longer function.

Related
Differentiating agentic and generative AI — and more with a Tech Q&A author
How AI is transforming the audit — and what it means for CPAs
Promises of ‘fast and easy’ threaten SOC credibility
Business today depends on data. The ability to efficiently acquire, access, and analyze information is essential to effective decision-making. And better decisions are key to building better businesses.
So how can accountants help their businesses and clients use data to be better prepared in the business decision derby? The first job is to prepare the data.
Data preparation refers to getting data ready for analytics and visualizations. Its core components include extracting data from the internet or local databases, transforming it by cleaning or joining datasets, and loading it into analytics or visualization tools. These three steps are commonly referred to as the ETL (extract, transform, and load) process.
Traditionally, accountants perform the ETL process by creating Excel formulas or modeling databases in Microsoft Access. However, those traditional tools often require accountants to spend a significant amount of time preparing the data manually.
Increasingly, many public accounting firms and businesses are using ETL tools that perform data preparation tasks in a time-efficient manner while maintaining accuracy. This provides a number of benefits for accountants.
HOW CPAs BENEFIT FROM ETL TOOLS
For the purposes of this article, let us define an ETL tool as a self-service software application that does not require programming skills. Its user-friendly functionality allows accountants to perform ETL tasks and prepare their data without going through a steep learning curve.
A good ETL tool allows for seamless data sourcing from a variety of files, databases, and cloud sources, thereby providing flexibility to any organization (a business, firm, not-for-profit, etc.) that collects a variety of source data. ETL tools offer many services, from creating simple summary statistics to building advanced regression models. Their flexibility makes them useful for a wide range of finance and accounting professionals, as follows:
Auditors
Many companies have begun to move toward continuous auditing, which is an automated method to check the effectiveness of a control, conduct rules-based testing, check for errors, and verify data more frequently. ETL tools are designed for those tasks. For example, auditors can get clients’ workflow and run tests on it to see if controls are sufficient by using different kinds of input datasets.
For auditors with smaller clients, ETL tools can bring tremendous value. Smaller clients tend to have multiple independent systems that are lacking integration and reside in silos. As a result, issues in data preparation (e.g., missing or duplicated records) may hinder the efficiency of an audit. With the power of ETL tools, auditors can resolve those issues quickly and spend more time in analytical tasks.
Tax professionals
Tax professionals often work with large amounts of data, which can be efficiently cleaned and joined using ETL tools. For example, dealing with tax data from multiple countries with a variety of formats can be particularly problematic, but ETL tools can provide efficient solutions to better assist with multicountry clients. These tools allow tax professionals to spend more time on value-added tasks, including predictive modeling, identifying trends, and modifying business procedures to improve efficiency.
Consulting and advisory professionals
Consulting and advisory professionals rely on data to evaluate their options before coming to a decision or recommendation. ETL tools can efficiently prepare the data for analysis to ultimately equip professionals in decision-making; for example, if a consultant is analyzing another company in the context of a merger or acquisition, ETL tools can import and clean data from multiple sources. Consultants can then analyze this data to determine whether the acquirer or the target is a desirable fit for acquisition.
GOING IN DEPTH WITH AN ETL TOOL
Accountants can choose from a number of ETL tools. As an example, this article focuses on an application called Alteryx, describing how it works, providing a tutorial, comparing it with Excel, and showing how accountants can benefit from its use. This article is intended as an introduction to the topic and is not an endorsement of Alteryx, which was selected for reasons outlined in the sidebar, “ETL Tool Options.”
THE BASICS OF ALTERYX
Alteryx’s key benefit is being able to clean, join, and organize large amounts of data through an interactive and automated workflow. Users can import data from multiple files or databases (including Access, Excel, and SAS, among others) into Alteryx, where they can build a custom workflow to clean and join datasets. These workflows can vary in complexity depending on the quality of the imported data and the intricacy of the task. The final table and figure outputs can be compiled in an Excel file in different sheets, which can easily be analyzed to create graphs and figures in visualization tools such as Tableau and Microsoft Power BI.
Upon opening Alteryx, users see a clear workflow window, as shown in the screenshot “New Workflow Screen.”
New workflow screen

The toolbar organizes all of Alteryx’s tools by function. Users can also add on-demand analytics tools (e.g., Microsoft Azure’s Machine Learning service tool) to the toolbar. Users can also use the search bar in the top-right corner (not shown) to quickly locate a specific tool.
The canvas, seen in the screenshot “Alteryx Workflow Example,” is where tools are dragged and dropped to achieve ETL goals. When these tools are linked together in the canvas, they create what Alteryx calls a workflow, which determines which tools will run and in what order. For every step in a workflow, users can add notes below each icon to explain the functions performed. This feature enhances the workflow’s readability and auditability.
Alteryx workflow example
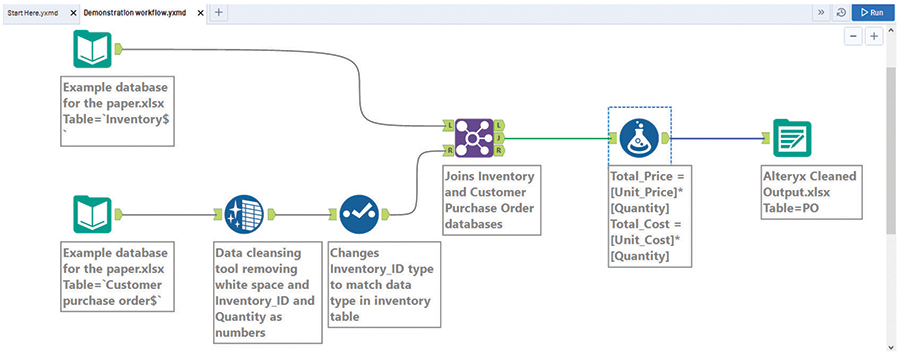
Once built, a workflow can be applied to datasets with the same structure by simply changing the data source, and the workflow can be reused for future clients or future projects. This feature enhances the ETL process’s efficiency and reduces the time required for data preparation. Once the tools are put together on the canvas, users press the blue Run button in the upper right-hand corner to run the workflow and see the outputs.
Next, we show the configuration panel, which is activated when a tool is selected by the cursor. This feature allows users to edit parameters related to a tool. For example, users can change the layout direction of the workflow and make it either horizontal or vertical, as shown in the screenshot “Workflow Configuration Options.”
Workflow Configuration options
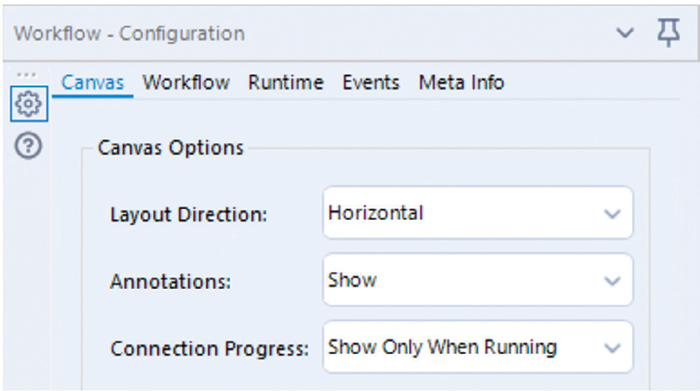
Finally, we show the results panel. This is activated after running a workflow. It shows the changes in the data and displays messages explaining the changes, as indicated in the screenshot “Results Panel.”
Results panel

ALTERYX VS. EXCEL: A DATA PREPARATION COMPARISON
To illustrate the efficiencies ETL applications can bring to data preparation, let’s do a quick comparison of Alteryx and Excel. Both applications have data cleaning, joining, and calculating capabilities. To compare the programs, we used Alteryx and Excel to clean and join the same datasets to determine the total order cost and total order price for each line item. You can view a video walkthrough of the Alteryx process at the end of this article.
The example included two sample databases:
- An inventory table that comes from a company enterprise resource planning (ERP) system with consistent formats and clean information.
- A customer purchase order (PO) table that comes from multiple customer information systems, is not yet clean, and lacks consistent formats. This raw dataset presents data integrity issues such as inconsistent data formats and extra spaces in data fields.
For a fair comparison, the entire process done in Excel must be formula-driven, so there is no need for manual changes or modification of information in any field. As a result, the steps in both Excel and Alteryx can be applied to larger databases with thousands of records in them.
Cleaning data
The first step in this process is cleaning the raw, or unclean, data in Excel, as shown in the screenshot “Raw and Clean Data in Excel.” The raw data is shown in dark blue and the cleaned data in light blue.
Raw and clean data in Excel
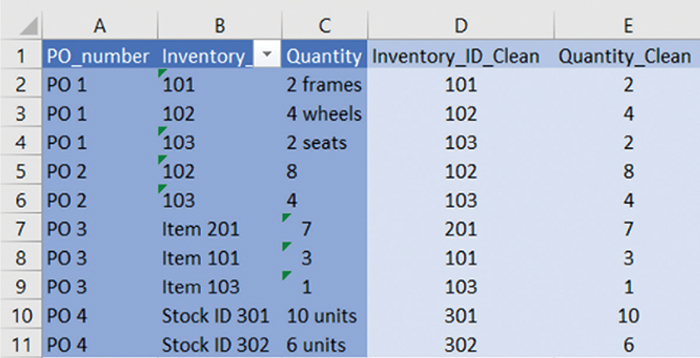
To produce the clean data, the following formula was used to remove characters from alphanumeric strings, leaving only numbers in the cell:
=SUMPRODUCT((MID(0&B2,LARGE(INDEX(ISNUMBER
(–MID(B2,ROW(INDIRECT(“1:”&LEN(B2))),1))
*ROW(INDIRECT(“1:”&LEN(B2))),0),ROW(INDIRECT
(“1:”&LEN(B2))))+1,1)*10^ROW(INDIRECT(“1:”&
LEN(B2)))/10)).
As you can see, the formula is complex and multilayered. Creating complex formulas in Excel to clean data can be time-consuming. The structure of this formula requires a deep understanding of Excel coding, and it uses multiple advanced functions such as SUMPRODUCT, ISNUMBER, and INDIRECT. Additionally, these functions are interdependent or layered with one another, making the formula complex to construct (e.g., the INDIRECT function being used within the overall SUMPRODUCT function). Accountants may find it difficult to explain such complicated formulas to clients or colleagues.
To perform the same task in Alteryx, the first step is to import the data by dragging and dropping the Input Data tool onto the canvas. Data can be inputted from various files and database types. Once the data has been imported, it is important to check the raw data’s quality to see what type of cleaning needs to be done. You can see two input files on the left side of the workflow in the screenshot “Alteryx Workflow Example.”
To do this, a user would press the Run button in the top-right corner of the screen and select the Input Data tool. Alteryx would then display the quality of data in the results panel, as shown in the screenshot “Raw and Clean Data in Alteryx.”
Raw and clean data in Alteryx
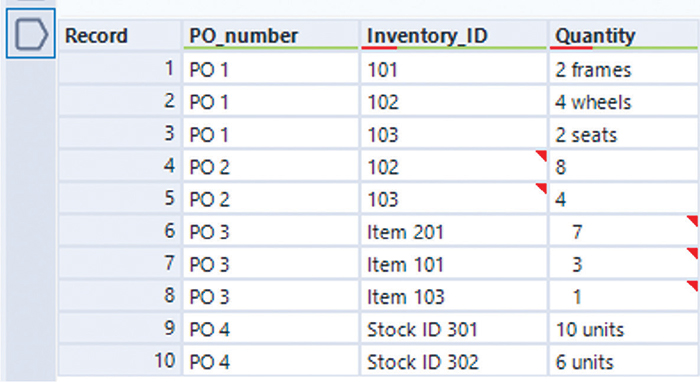
Under each column name, you can see either a green or red bar. A green bar indicates that the values do not have leading or trailing white spaces, like the PO_Number column. A red bar indicates that certain values within the column have leading or trailing white spaces, such as the Inventory_ID and Quantity columns.
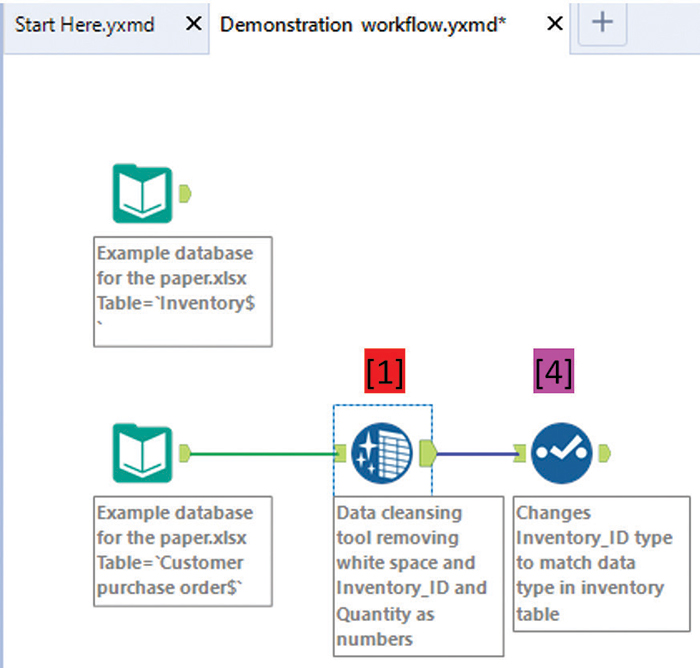
To clean these columns, the blue Data Cleansing tool, shown by the number [1] in the screenshot “Cleaning: Steps 1 and 4,” is dragged and dropped into the canvas to connect with the imported “Customer Purchase Orders” dataset. When the user selects this tool, the configuration panel changes to what is pictured at [2] in the screenshot “Cleaning: Step 2.”
Cleaning: Steps 1 and 4
Cleaning: Step 2
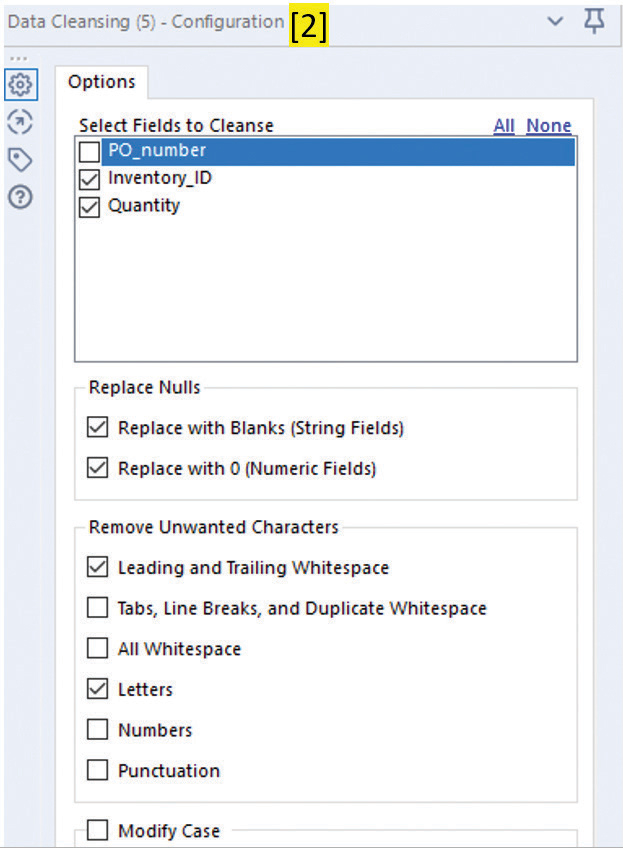
Under the Remove Unwanted Characters section, both Leading and Trailing Whitespace and Letters were selected. Once the Run button is clicked, the output can be seen in the results section.
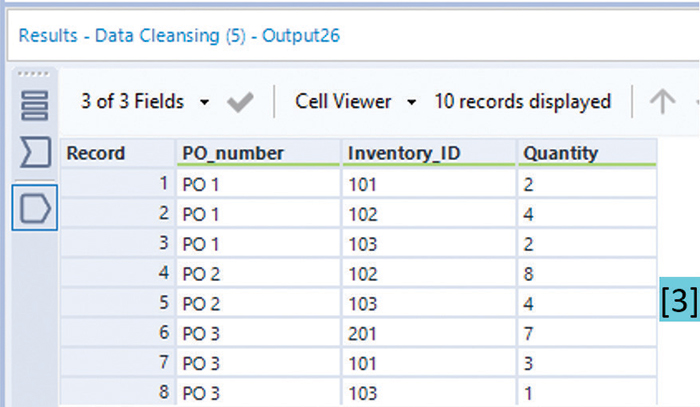
The previously partly red bar has turned completely green for both Inventory_ID and Quantity, meaning that all leading and trailing whitespace has been removed, [3], as shown in the screenshot “Cleaning: Step 3.” Additionally, only the numbers in the Inventory_ID and Quantity column remain, thereby cleaning the data for use in calculations. This Data Cleansing tool allows for efficient cleaning by removing extraneous characters in one click.
Cleaning: Step 3
The Select tool [4] appears in “Cleaning: Steps 1 and 4” in this section. It is used to change the variable types of Inventory_ID and Quantity from String (textual data) to Double (numerical data), allowing these values to be used in calculations.
Joining datasets and applying formulas in Excel
The next step in this process is joining different datasets.
In Excel, the data in the first three columns was imported from the cleaned dataset into a new sheet. A VLOOKUP formula was used to retrieve the data for the following columns in the inventory database: type, unit_cost, and unit_price. To calculate total_price and total_cost, the respective unit costs and unit prices were multiplied by the quantity provided, as shown in the screenshot “VLOOKUP Formula and Results.”
VLOOKUP formula and results
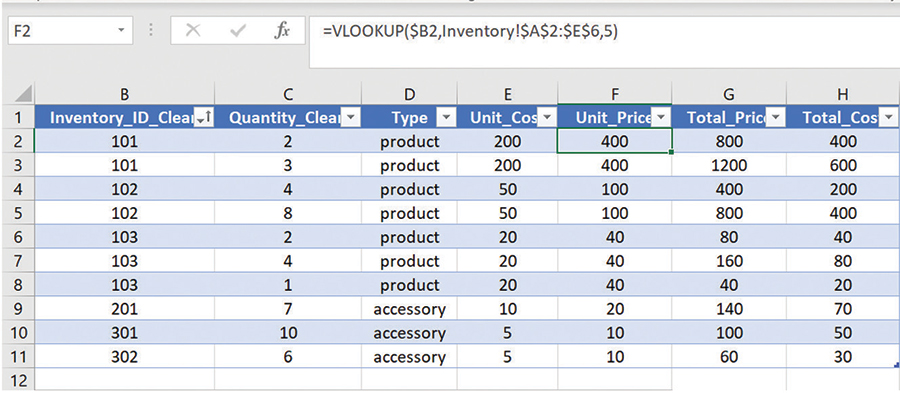
As you can see, the VLOOKUP tool requires accurate specifications of the search area (e.g., the use of the dollar sign ($) to fix columns or rows), and entering numbers as the wrong data type or inserting columns may jeopardize the integrity of the dataset. For complicated databases, using VLOOKUP may produce errors in the joined data if the formulas are specified incorrectly. For accountants, troubleshooting errors in formulas could take a tremendous amount of time.
Joining datasets and applying formulas in Alteryx
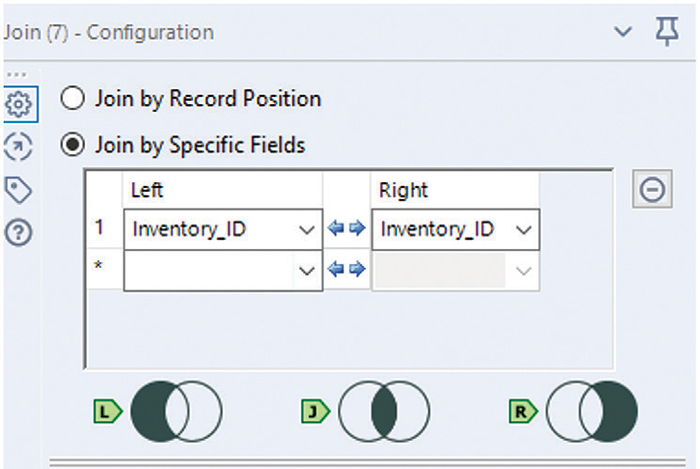
To join the inventory and customer purchase order databases in Alteryx, users simply drag and drop the Join tool onto the canvas. Once the Join tool is selected, the configuration panel changes to the display shown in the screenshot “Join Configuration Panel.” In this example, the datasets will be joined through Inventory_ID, as this is a common value.
Join Configuration panel
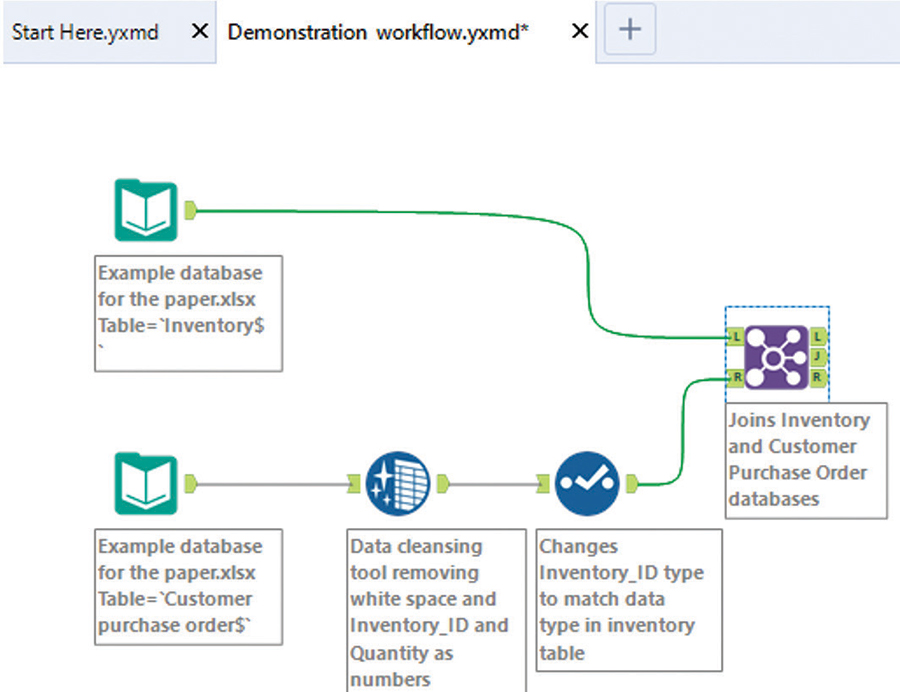
A closer look at the Join tool reveals two inputs and three outputs, as shown in the screenshot “Join in the Workflow.” The inputs L and R on the left of the tool designate the two datasets before the join. The output J represents the dataset after an inner join, which selects all rows from both databases that have a match in a common column. The output L is the left unjoin table (unmatched records from the L input dataset), and the output R is the right unjoin table (unmatched records from the R input dataset).
Join in the workflow
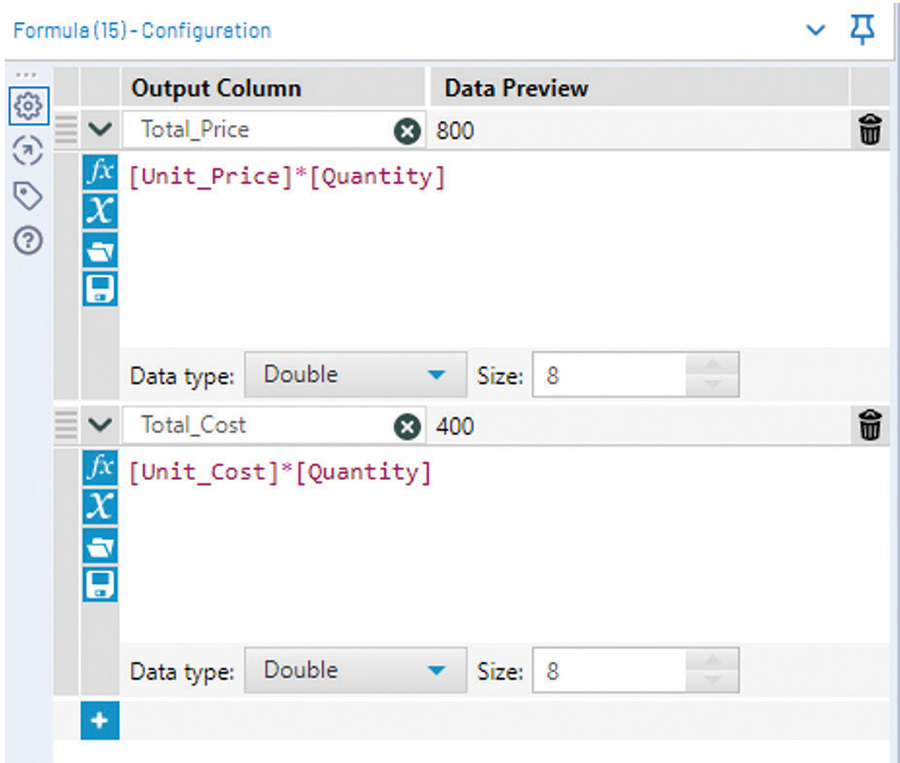
To calculate total_price and total_cost, users simply drag the Formula tool and connect it with the output J database.
The Formula tool works like formulas in Excel, performing calculations on variables, modifications on variable types, validation tests on data, and more. The screenshot “Formula Configuration Panel” shows how the configuration panel of the Formula tool is used to calculate total price and total cost by multiplying unit_price or unit_cost with quantity.
Formula Configuration panel
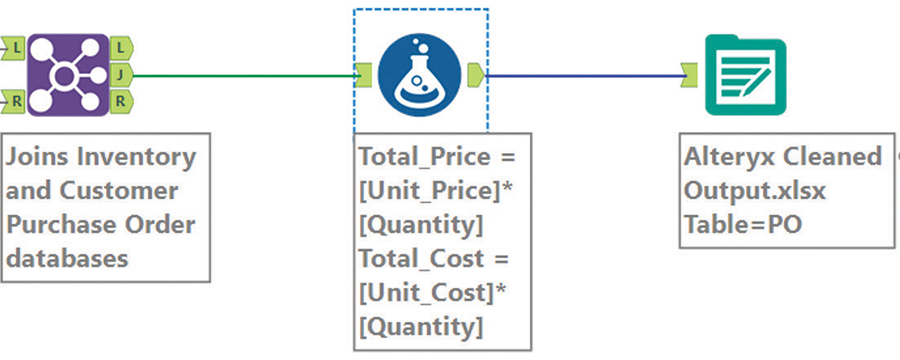
Finally, using the Output Data tool, users can save the output data in a new Excel worksheet. The original input file the data is imported from is not altered, thereby maintaining the data’s integrity.
Output Data is the last task in the workflow, as shown in the screenshot “Join, Formula, and Output Added.”
Join, Formula, and Output added
MOVING FORWARD WITH YOUR WORKFLOW
Now that your workflow is complete, you should save it for future use. Doing so can save time when performing similar processes on different data sources.
To save, go to File > Save in Alteryx, enter a file name, and save it in any folder/location. After that, just open the workflow, change the inputs in the workflow, and run.
Taking the time upfront to set up a workflow structure that is reusable with different data inputs can save you time and aggravation on data extraction and transformation. And whether you use Alteryx or another ETL tool, the investment in streamlining the data preparation process can pay dividends in easier, quicker access to the information needed to drive the best business decisions.
ETL tool options
Alteryx is far from the only ETL tool available. Here is a look at a few others and an explanation of why this article focuses on Alteryx.
Power Query, Tableau Prep, and Trifacta are options similar to Alteryx. Power Query allows users to perform simple ETL tasks on top of Excel spreadsheets. However, for complicated ETL tasks such as the data-cleaning step described in the main article, users would still need to create customized Excel formulas to remove the textual components from alphanumeric inputs.
Tableau Prep is a basic tool to combine, shape, and clean data before designing visualizations in Tableau. However, Tableau Prep offers limited functions, which may make it less desirable for complicated ETL tasks.
Programmers and data scientists use Trifacta because it is highly customizable for users who are comfortable with writing codes or commands. Although Trifacta can handle complicated ETL tasks, the learning curve can be painfully steep for accountants without a strong IT background.
Alteryx occupies a middle ground between Tableau Prep, Trifacta, and Excel’s Power Query in terms of functionality and ease of use. When it comes to pricing, however, Power Query is easily the most affordable, and it is embedded with Microsoft Office. Tableau Prep is another affordable option, as it is included in the Tableau Creator package, which costs $840 per user per year. Alteryx and Trifacta cost $5,195 and $5,028 per user per year, respectively.
Why the big price differences? Excel Power Query and Tableau Prep are designed for easy tasks that require somewhat-clean data to start with. In contrast, Alteryx and Trifacta can deal with almost all kinds of raw data.
In addition, Alteryx can connect with a variety of analytical tools such as the Microsoft Azure Machine Learning tool and run analytics immediately after the data is cleaned. Also, those analytical tools are integrated as parts of the workflow with Alteryx, and users can run the same cleaning and analytics periodically on new data by clicking the Run button once the workflow is completed.
About the authors
James Zhang, CPA, Ph.D., CMA, SAP, is an assistant professor; Snigdha Porwal is an EY Undergraduate Scholar; and Tim V. Eaton, CPA, Ph.D., is a professor and EY Teaching Scholar, all in the Department of Accountancy at Miami University’s Farmer School of Business.
To comment on this article or to suggest an idea for another article, contact Jeff Drew, a JofA senior editor, at Jeff.Drew@aicpa-cima.com or 919-402-4056.
AICPA resources
Articles
- “Excel vs. Tableau: See Your Data Differently,” JofA, March 2020
- “Power BI: An Analytical View,” JofA, March 2020
CPE self-study
- Data Analytics Certificate Programs
- Digital Mindset Pack — Data Analytics Focus
- Data Analytics Modeling Certificate (#188330, online access)
Conferences
- AICPA/CPA.com Digital CPA Conference 2020, Dec. 8, online only
- Practitioners Symposium and Tech+ Conference at AICPA Engage, June 7—10, Las Vegas
For more information or to make a purchase or register, go to future.aicpa.org/cpe-learning or call the Institute at 888-777-7077.
IMTA Section and CITP credential
The Information Management and Technology Assurance (IMTA) Section supports AICPA members who provide services in the areas of information security and cyber risk, privacy and IT risk management, business intelligence, and emerging technologies. CPAs may also pursue the Certified Information Technology Professional (CITP) credential, which demonstrates an individual has the expertise to advise organizations on how to maximize information technology to manage their business. Access to IMTA’s tools and resources is included with AICPA membership. To learn more, visit aicpa.org/IMTA and aicpa.org/CITP.


